Review
. 2013 Oct 21:7:158.
doi: 10.3389/fncir.2013.00158. eCollection 2013.

Cortico-basal ganglia networks subserving goal-directed behavior mediated by conditional visuo-goal association

Affiliations
Review

Cortico-basal ganglia networks subserving goal-directed behavior mediated by conditional visuo-goal association

Eiji Hoshi. Front Neural Circuits. .

Abstract

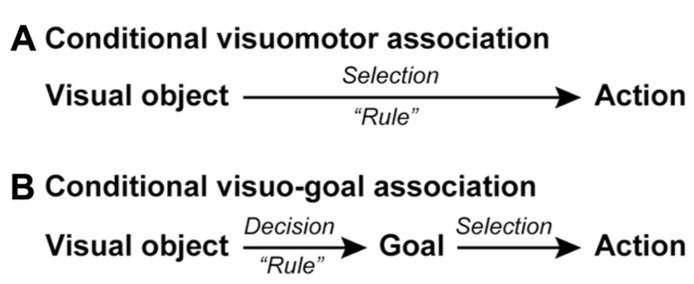
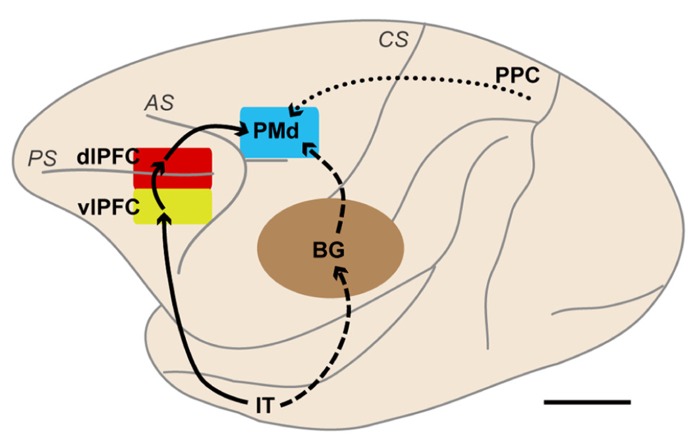
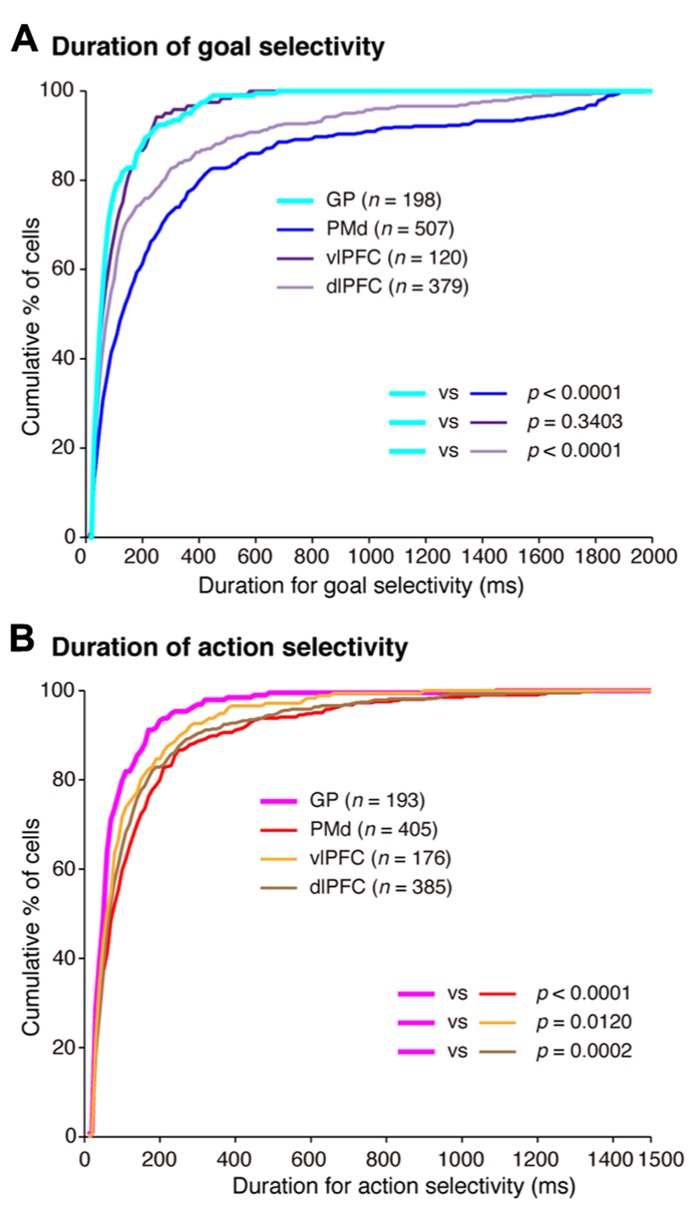
Action is often executed according to information provided by a visual signal. As this type of behavior integrates two distinct neural representations, perception and action, it has been thought that identification of the neural mechanisms underlying this process will yield deeper insights into the principles underpinning goal-directed behavior. Based on a framework derived from conditional visuomotor association, prior studies have identified neural mechanisms in the dorsal premotor cortex (PMd), dorsolateral prefrontal cortex (dlPFC), ventrolateral prefrontal cortex (vlPFC), and basal ganglia (BG). However, applications resting solely on this conceptualization encounter problems related to generalization and flexibility, essential processes in executive function, because the association mode involves a direct one-to-one mapping of each visual signal onto a particular action. To overcome this problem, we extend this conceptualization and postulate a more general framework, conditional visuo-goal association. According to this new framework, the visual signal identifies an abstract behavioral goal, and an action is subsequently selected and executed to meet this goal. Neuronal activity recorded from the four key areas of the brains of monkeys performing a task involving conditional visuo-goal association revealed three major mechanisms underlying this process. First, visual-object signals are represented primarily in the vlPFC and BG. Second, all four areas are involved in initially determining the goals based on the visual signals, with the PMd and dlPFC playing major roles in maintaining the salience of the goals. Third, the cortical areas play major roles in specifying action, whereas the role of the BG in this process is restrictive. These new lines of evidence reveal that the four areas involved in conditional visuomotor association contribute to goal-directed behavior mediated by conditional visuo-goal association in an area-dependent manner.

Keywords: action; executive function; globus pallidus; goal; sensorimotor integration; visuomotor integration.


Figures

FIGURE 1
FIGURE 1
Schematic representations of conditional visuomotor association and conditional visuo-goal association. (A) In conditional visuomotor association, perceptual signals representing visual objects are directly mapped onto the motor signals (actions) in a rule-dependent manner to achieve an action selection. (B) In conditional visuo-goal association, perceptual signals are first mapped in a rule-dependent manner onto signals representing behavioral goals for making a goal decision. The goal-related signals are subsequently transformed into signals representing actions, corresponding to an action selection.
FIGURE 2
FIGURE 2
Brain networks centered on the dorsal premotor cortex (PMd) involved in motor behavior based on visual object and visuospatial signals. The solid lines indicate a pathway from the IT to the PMd via the vlPFC and dlPFC. The broken lines indicate pathways from the IT to the PMd. These two types of pathways are thought to be involved in behavior based on visual-object signals, such as those involved in conditional visuomotor association and conditional visuo-goal association. The dotted line indicates a pathway from the PPC to the PMd. This pathway is considered to carry visuospatial information. BG, basal ganglia; dlPFC, dorsolateral prefrontal cortex; IT, inferotemporal cortex; PMd, dorsal premotor cortex; PPC, posterior parietal cortex; vlPFC, ventrolateral prefrontal cortex; AS, arcuate sulcus; CS, central sulcus; PS, principal sulcus. Scale bar, 10 mm.
FIGURE 3
FIGURE 3
Hierarchical organization of reaching movement. Three levels of information processing are summarized schematically. The first level represents the components of the reaching movement, such as arm use and target location. The second level integrates these components to plan the reaching movement. The third level prepares and executes the planned movement.
FIGURE 4
FIGURE 4
Temporal sequence of behavioral events. (A) The trial in which a signal about arm use (“arm”) was followed by a signal about the target to reach for (“target”). (B) The trial in which the two signal were given in the reverse order. When a monkey placed one hand on each touch pad and gazed at a fixation point (FP), the first instruction (cue 1; 400 ms in duration), which contained information about either the target location or which arm to use, was presented. A small, colored cue indicated the type of signal (i.e., whether it related to target location or arm use). A green square was used for an arm-use signal, whereas a blue cross was used for a target-location signal. At the same time, a white square appeared to the left or right of the FP and indicated laterality of arm use (for arm-related instructions) or target location (for target-related instructions). After the subsequent delay period (delay 1) that lasted ≥1,200 ms, the second instruction (cue 2: 400 ms) was given to complete the information required for the subsequent action. After the second delay (delay 2: ≥1,200 ms), squares appeared on each side of the fixation point (set cue: ≥1,000 ms), signaling the monkey to prepare to reach for the target when the fixation point disappeared (the GO signal). If the monkey subsequently reached for the appropriate target with the appropriate arm, s/he received a reward. The order of appearance of the target and arm signals was alternated in a block of 20 trials, and laterality was randomized within each block. A series of five 250 Hz tones was presented after a reward signaled a reversal of the order of the instructions.
FIGURE 5
FIGURE 5
Three types of neuronal activity in the PMd when monkeys planned a forthcoming reaching movement. (A–C) Three examples of PMd neuronal activity presented with raster displays and plots of spike density functions (SDFs). Gray areas (from left to right) represent when the first, second, and set cues were presented. Tick marks on the abscissa are at 400-ms intervals. First and second signals are shown at the top of each panel (RA, right arm; LA, left arm; RT, right target; LT, left target). SDFs (Gaussian kernel, σ = 20 ms, mean ± SE) appear below each raster display. Raster plots and SDFs were aligned to the onset of the first and second signal and the onset of the set cue. The ordinate represents the instantaneous firing rate. Of the eight possible sequences of first and second cues (four instructions × two presentation orders), only four are illustrated. (A) Activity of this PMd neuron was greater when cue 1 signaled the use of the right arm (RA). (B) Activity of this PMd neuron was greater when cue 1 signaled the right target. (C) Activity of this PMd neuron was observed when the combination of the two signals was RA (use of the right arm) and LT (left target). Activity was similar, regardless of the order of the two instructions (adapted from Hoshi and Tanji, 2006).
FIGURE 6
FIGURE 6
Symbolic cue task. (A) Temporal sequence of behavioral events in the symbolic cue task. If the monkey continued to gaze at the fixation point for 1,200 ms, a cue was randomly presented for 800 ms to signal the animal to select either the right or the left target (i.e., the behavioral goal). A green circle and a yellow square signaled selection of the target on the right, whereas a red diamond and a blue cross indicated that the left target should be selected (B). Because no information about future targets was available at this stage, the monkeys were required to select right or left without specifying a forthcoming action. If the monkey continued to gaze at the fixation point for 1,200 ms during the subsequent delay, a choice cue consisting of two gray squares appeared at one of six different locations on the screen (C). At this point, the animal could specify what to do (i.e., action) for the first time. After 1,500–2,500 ms, the color changed from gray to white (the GO signal). If monkeys reached for the target with their right arm, they received a fruit juice reward 500 ms after touching the correct square. (B) Visual signals used to designate selection of left or right in the forthcoming choice cue. (C) Locations of the choice cue and target on the screen. For the choice cue, two gray squares appeared at neighboring positions (locations 0–6, depicted with dotted squares). The target position was selected from five potential targets (T1–T5) that were located on the left or the right of the choice cue.
FIGURE 7
FIGURE 7
Two examples of neurons in the PMd. (A) Goal-related activity of a PMd neuron. Activity of this PMd neuron increased when either a red diamond or a blue cross was used to specify the left target. (B) Action-related activity of a PMd neuron. After choice-cue onset, this PMd neuron exhibited more activity when the correct target was located on the right side of the screen (T5), regardless of the goal. Of the five positions (T1–T5), only three (T1, T3, and T5) are displayed here. (A,B) Rasters and spike-density functions (smoothed using a Gaussian kernel; σ = 10 ms, mean ± SEM) indicate activity in sorted trials. The ordinate represents the instantaneous firing rate (spikes/s). Neuronal activity was aligned with the onset of the instruction, choice-cue, and GO signals. Gray areas on the left indicate when the instruction was presented, and gray areas in the middle and on the right represent when the choice cue was presented. Tick marks on the horizontal axis are placed at 200-ms intervals (adapted from Nakayama et al., 2008).
FIGURE 8
FIGURE 8
Distribution of selective neurons in the PMd, vlPFC, dlPFC, and GP. Pie charts summarize the proportion of neurons classified into five categories. Two sets of data are shown for 101–300 ms after the onset of instruction cue (A) and 101–300 ms after the onset of the choice cue (B). Each category is color coded according to the inset. The parentheses enclose the number of neurons. Green, object neurons; Blue, goal neurons; Gray, neurons selective for choice-cue location; Yellow, neurons selective for both goal and choice-cue location; Red, action neurons (adapted from Arimura et al., 2013).
FIGURE 9
FIGURE 9
Overlaps of axon terminals arising from the vlPFC and cell bodies projecting to the PMd in the frontal cortex. (A) Five representative coronal sections are arranged rostrocaudally. The approximate rostrocaudal levels of the sections (a–e) are indicated in the lateral view of the brain (with the sites of BDA and FB injections specified by blue and red circles, respectively). Labels in blue represent axon terminals labeled with BDA injected into vlPFC (area 45), and labels in red represent cell bodies labeled with FB injected into PMd. (B) A two-dimensional density map showing the distribution patterns of axon terminals labeled with BDA and cell bodies labeled with FB. The bins (900 × 1,000 μm) where the BDA-labeled axon terminals were observed appear in blue. The box encloses the area where BDA terminals were investigated. The gray zone denotes the extent of the FB or BDA injection sites. Three different sizes of filled circles represent the numbers of neurons labeled with FB. Arrowheads (a–e) point to the approximate rostrocaudal levels of coronal sections (a–e) shown in (A). BDA, biotinylated dextran amine; FB, Fast Blue. AS, arcuate sulcus; CgS, cingulate sulcus; F7, area F7 (Luppino et al., 2003); iAS, inferior limb of AS; PS, principal sulcus; sAS, superior limb of AS (adapted from Takahara et al., 2012).
FIGURE 10
FIGURE 10
Two examples of neurons in the prefrontal cortex selective for visual objects (A) and behavioral goals (B). (A) Activity of this vlPFC neuron increased when the yellow square was presented. (B) Activity of this dlPFC neuron increased when the instruction was presented and either a red diamond or a blue cross was used to specify the left target. The display formats are the same as those used in Figure 7 (adapted from Yamagata et al., 2012).
FIGURE 11
FIGURE 11
Comparison of the development of selectivity for visual objects, behavioral goals, and actions. (A) Cumulative fractions of selectivity onset for visual objects in the GP (light green) and vlPFC (dark green) after instruction-cue onset in the symbolic cue task. (B) Cumulative fractions of selectivity onset for the behavioral goal in the GP (light blue), PMd (dark blue), vlPFC (dark purple), and dlPFC (light purple) after instruction-cue presentation in the symbolic cue task. (C) Cumulative fractions of the onset of action selectivity in the GP (pink), PMd (red), vlPFC (orange), and dlPFC (brown) after choice-cue onset in the symbolic cue task. (A–C) The p-values indicate the results of the statistical analysis (Kolmogorov–Smirnov test) between the GP and the other three areas (adapted from Arimura et al., 2013).
FIGURE 12
FIGURE 12
Two examples of neurons in the GP selective for a visual object and a behavioral goal in the symbolic cue task. (A) Activity of this GP neuron decreased when a red diamond was presented as an instruction cue, whereas it increased when a blue cross was presented as an instruction cue. (B) Activity of this GP neuron decreased when either a red diamond or a blue cross was presented. Neuronal activity was aligned with the onset of the instruction cue. The gray areas on the left indicate when the instruction was presented, and the gray areas on the right represent the earliest presentation of the choice cue. The tick marks on the horizontal axis are placed at 200-ms intervals. The display formats are the same as those used in Figure 7 (adapted from Arimura et al., 2013).
FIGURE 13
FIGURE 13
Temporal profiles of neuronal selectivity for behavioral goals and actions in the symbolic cue task. (A) Cumulative fractions of the duration of goal selectivity in the GP (light blue), PMd (dark blue), vlPFC (dark purple), and dlPFC (light purple) after instruction cue-onset in the symbolic cue task. (B) Cumulative fractions of the duration of action selectivity in the GP (pink), PMd (red), vlPFC (orange), and dlPFC (brown) after choice-cue presentation in the symbolic cue task. In (A) and (B), the parentheses enclose the number of neurons with an onset of selectivity ≤2,000 ms after instruction-cue onset (for goal selectivity, A) and ≤1,500 ms after choice-cue onset (for action selectivity, B). The p-values indicate the results of the statistical analysis (Kolmogorov–Smirnov test) examining differences between neurons in the GP and the three cortical areas (adapted from Arimura et al., 2013).

Similar articles

Cited by

References

    1. Abe M., Hanakawa T. (2009). Functional coupling underlying motor and cognitive functions of the dorsal premotor cortex. Behav. Brain Res. 198 13–2310.1016/j.bbr.2008.10.046 - DOI - PubMed
    1. Alexander G. E., Crutcher M. D. (1990a). Functional architecture of basal ganglia circuits: neural substrates of parallel processing. Trends Neurosci. 13 266–27110.1016/0166-2236(90)90107-L - DOI - PubMed
    1. Alexander G. E., Crutcher M. D. (1990b). Neural representations of the target (goal) of visually guided arm movements in three motor areas of the monkey. J. Neurophysiol. 64 164–178 - PubMed
    1. Alexander G. E., Crutcher M. D. (1990c). Preparation for movement: neural representations of intended direction in three motor areas of the monkey. J. Neurophysiol. 64 133–150 - PubMed
    1. Alexander G. E., Delong M. R., Strick P. L. (1986). Parallel organization of functionally segregated circuits linking basal ganglia and cortex. Annu. Rev. Neurosci. 9 357–38110.1146/annurev.ne.09.030186.002041 - DOI - PubMed

Publication types

MeSH terms