. 2013 Oct 21:7:165.
doi: 10.3389/fncir.2013.00165. eCollection 2013.

Toward a self-wired active reconstruction of the hippocampal trisynaptic loop: DG-CA3

Affiliations

Toward a self-wired active reconstruction of the hippocampal trisynaptic loop: DG-CA3

Gregory J Brewer et al. Front Neural Circuits. .

Abstract

The mammalian hippocampus functions to encode and retrieve memories by transiently changing synaptic strengths, yet encoding in individual subregions for transmission between regions remains poorly understood. Toward the goal of better understanding the coding in the trisynaptic pathway from the dentate gyrus (DG) to the CA3 and CA1, we report a novel microfabricated device that divides a micro-electrode array into two compartments of separate hippocampal network subregions connected by axons that grow through 3 × 10 × 400 μm tunnels. Gene expression by qPCR demonstrated selective enrichment of separate DG, CA3, and CA1 subregions. Reconnection of DG to CA3 altered burst dynamics associated with marked enrichment of GAD67 in DG and GFAP in CA3. Surprisingly, DG axon spike propagation was preferentially unidirectional to the CA3 region at 0.5 m/s with little reverse transmission. Therefore, select hippocampal subregions intrinsically self-wire in anatomically appropriate patterns and maintain their distinct subregion phenotype without external inputs.

Keywords: GAD67; GFAP; burst; dentate gyrus; multielectrode array.


Figures
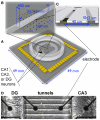
Figure 1
Figure 1
Experimental system for reconstruction of hippocampal sub-regional circuits on multi-electrode array. (A) Dual culture chamber on microelectrode array separated by microtunnels. Note ground electrode on lower left for common culture medium, (B) 51 tunnels of 400 um length aligned to the 8 columns of electrodes. (C) Fifty-one tunnels of 3 × 10 um cross section were separated by 40 um with alignment over one pair of dark electrodes shown. (D) Phase contrast imaging of live neurons shows how the tunnels promoted selective growth of axons from one compartment into another.
Figure 2
Figure 2
Expression of region-enriched genes in sub-compartments phenocopies selective expression in the adult hippocampus as measured by qPCR. Specific genes probed for expression after 3 weeks in (A) the indicated homogeneous random cultures without tunnel devices. Note enrichment of Trpc6 in the DG cultures, Prkcd in the CA3 cultures, and Nov in the CA1 cultures. (B) The same hippocampal subregions plated into each of two compartments of the tunnel device. Note same enrichment profile in the tunnel device as in the random cultures. (C) Enriched expression of the DG gene Trpc6 whenever DG neurons are present in heterologous combinations of hippocampal subregions cultured between tunnels, normalized to DG cultured on both sides of the tunnels. (D) Enriched expression of the CA3 gene Prkcd when CA3 neurons are present in heterologous combinations of hippocampal sub-regions cultured between tunnels, normalized to CA3 cultured on both sides of the tunnels. (E) Enriched expression of the CA1 gene Nov when CA1 neurons are present in heterologous combinations of hippocampal sub-regions cultured between tunnels, normalized to CA1 cultured on both sides of the tunnels. Note the similar expression of each region-specific gene to neurons of that region in combination with heterologous regions, while the other 4 combinations without this region express lower levels of this marker mRNA (n = 3 separate cultures).
Figure 3
Figure 3
Region-specific burst dynamics. Normal distribution statistics indicate (A) mean extra-burst spike rate differs (i) in tunnels compared to corresponding random cultures and (ii) is higher for DG than CA3 apposed across tunnels. (B) Percent spikes in bursts are generally higher for any DG culture than any CA3 culture. Log normal distribution statistics apply to (C–F). (C) Burst duration was longer for DG than CA3 when they were apposed. For random cultures without tunnel devices, DG burst durations are much lower than CA3 random cultures. (D) Inter-burst intervals are lengthened by 50% in DG apposed to CA3 compared to DG self-apposed across tunnels and 300% compared to DG in random networks. Similarly, inter-burst times are longer for CA3 apposed to DG than CA3 apposed to itself or random CA3 cultures. (E) Intra-burst spike rates are shortened by 20% in DG apposed to CA3 compared to DG self-apposed across tunnels but longer in the reverse direction. (F) Spikes per burst decreased by 14% in DG apposed to CA3 compared to DG self-apposed across tunnels and even less in the reverse direction. In all cases n displayed is total degrees of freedom from burst or non-burst segments from 3 min recordings of networks of 4 random DG, 4 random CA3, 8 DG(DG), 8 CA3(CA3), 5 DG(CA3), and 5 CA3(DG). Different letters above bars indicate significant differences (a shared letter indicates a non-significant comparison) by post-hoc Tukey multiple-comparison analysis after significant ANOVA, p < 0.05, normal distribution statistics.
Figure 4
Figure 4
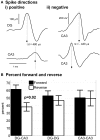
Native polarity established from DG to CA3. Delay times of spikes traveling in axons in tunnels were determined from the difference in spike times at two tunnel electrodes separated by 200 μm. (Ai) Example of spike travelling from DG to CA3 with a 480 μs delay indicating a velocity of 0.42 m/s. (ii) Example of spike propagation from the top to the bottom compartment (arbitrarily designated reverse direction for CA3-CA3). (B) Statistical analysis of directional propagation indicates 62% of tunnels spontaneously connect axons with anatomical accuracy from DG-CA3, while homologous regions across tunnels fail to show polarity (Wilcoxin non-parametric test).
Figure 5
Figure 5
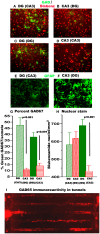
DG networks contain 3–5× more GABAergic (GAD67-GFP) neurons than CA3 networks while CA3 has more astroglia. Some GAD+ neurons traverse the tunnels. (A–D) Green is GAD67-GFP expression 11 days after infection with Lenti-virus with GAD-67 promoter fused to GFP. Red is pseudocolored for blue bisbenzamide labeled nuclei. (E,F) GFAP immunostain in DG or CA3 compartments. (G) Nuclei per somata from bisbenzamide stain for DNA. Note red vertical striped CA3 apposed to DG is 50% higher than CA3 by itself. (H) Percent GAD67 labeled neurons per nuclei. (N = 6 20× fields from each of 2 networks). (I) GAD65 immunolabeled axons traverse tunnels.

References

    1. Amaral D. G., Lavenex P. (2006). Hippocampal neuroanatomy, in The Hippocampus Book, eds Andersen P., Morris R., Amaral D., Bliss T., O'Keefe J. (New York, NY: Oxford University Press; ), 37–114
    1. Baranes D., Lopez-Garcia J. C., Chen M., Bailey C. H., Kandel E. R. (1996). Reconstitution of the hippocampal mossy fiber and associational-commissural pathways in a novel dissociated cell culture system. Proc. Natl. Acad. Sci. U.S.A. 93, 4706–4711 10.1073/pnas.93.10.4706 - DOI - PMC - PubMed
    1. Bayer S. A. (1980). Development of the hippocampal region in the rat. I. Neurogenesis examined with 3H-thymidine autoradiography. J. Comp. Neurol. 190, 87–114 10.1002/cne.901900107 - DOI - PubMed
    1. Berdichevsky Y., Staley K. J., Yarmush M. L. (2010). Building and manipulating neural pathways with microfluidics. Lab Chip 10, 999–1004 10.1039/b922365g - DOI - PMC - PubMed
    1. Boehler M. D., Leondopulos S. S., Wheeler B. C., Brewer G. J. (2012). Hippocampal networks on reliable patterned substrates. J. Neurosci. Methods 203, 344–353 10.1016/j.jneumeth.2011.09.020 - DOI - PMC - PubMed

Publication types