. 2013 Oct 22:7:167.
doi: 10.3389/fncir.2013.00167. eCollection 2013.

Optogenetic stimulation effectively enhances intrinsically generated network synchrony

Affiliations

Optogenetic stimulation effectively enhances intrinsically generated network synchrony

Ahmed El Hady et al. Front Neural Circuits. .

Abstract

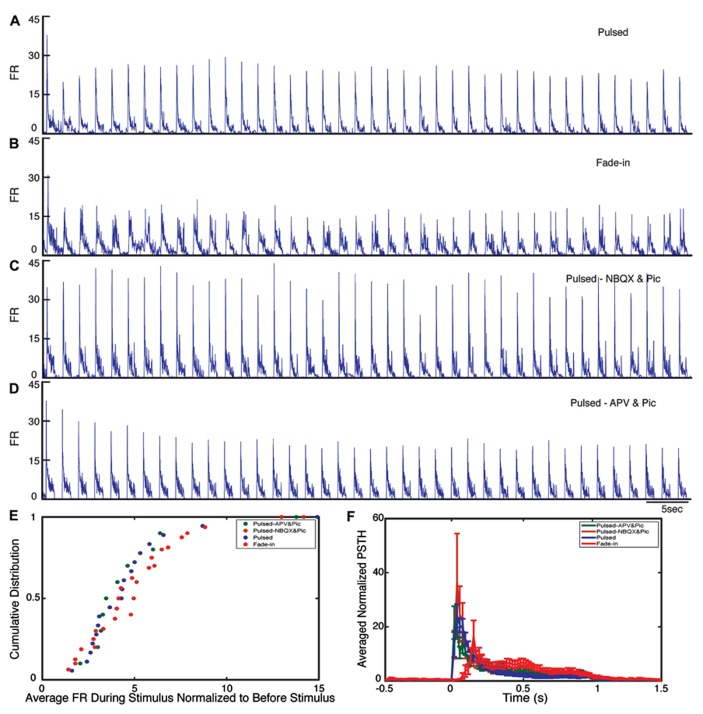
Synchronized bursting is found in many brain areas and has also been implicated in the pathophysiology of neuropsychiatric disorders such as epilepsy, Parkinson's disease, and schizophrenia. Despite extensive studies of network burst synchronization, it is insufficiently understood how this type of network wide synchronization can be strengthened, reduced, or even abolished. We combined electrical recording using multi-electrode array with optical stimulation of cultured channelrhodopsin-2 transducted hippocampal neurons to study and manipulate network burst synchronization. We found low frequency photo-stimulation protocols that are sufficient to induce potentiation of network bursting, modifying bursting dynamics, and increasing interneuronal synchronization. Surprisingly, slowly fading-in light stimulation, which substantially delayed and reduced light-driven spiking, was at least as effective in reorganizing network dynamics as much stronger pulsed light stimulation. Our study shows that mild stimulation protocols that do not enforce particular activity patterns onto the network can be highly effective inducers of network-level plasticity.

Keywords: bursting; multi-electrode arrays; network-level plasticity; optogenetics; synchronization.


Figures

FIGURE 1
FIGURE 1
Burst detection algorithm. (A) Typical electrical activity of a culture recorded via all 60 channels and the corresponding FR of AEs (gray line). In (B), the average spontaneous FRs over 300 s of the corresponding electrodes are shown. The graph (C) shows the rank ordered FRs of all electrodes. Selection of the active electrodes (AE), electrodes with average FR larger than 0.1 Hz is illustrated. The threshold for detecting a burst is defined as 1/4 of the inverse average FR of all AE. (D) Raster plot of an example burst. The threshold inter-spike interval (ISI), τ, is marked in (D) for comparison. (E,F) Normalized average IBFR of one experiment with fade-in stimulation before and after stimulus (normalized to the peak of average IBFR before stimulus). The red line shows the average IBFR by aligning the bursts by the onset of the detected burst and blue line shows the average IBFR by aligning bursts by their first peak.
FIGURE 2
FIGURE 2
Optical network electrophysiology. Panel (A) shows the experimental setup including channelrhodopsin-2 transduced neurons cultured on a multi-electrode array stimulated by whole-field blue light illumination using a high-power LED (B). The data is acquired by a MEA amplifier and a recording computer. The cultures are stimulated with either pulsed or fade-in stimuli (C). Panel (D) shows a representative raster plot of spontaneous activity in a network before stimulation across all 60 electrodes. Panel (E) presents evoked activity of the network during pulsed blue-light stimulation. The light blue color marks the duration of blue-light stimulation. Panel (F) present the electrode averaged normalized peri-stimulus time histogram (PSTH) for both pulsed (dark blue) and fade-in stimulation (red).
FIGURE 3
FIGURE 3
Evoked activity during light stimulation. (A–D) Average normalized firing rate (FR) during each pulse of stimulation (normalized to the average FR before stimulus) for pulsed (n = 18 experiments), fade-in (n = 16 experiments), pulsed stimulation on cultures with presence of NBQX/Picrotoxin (n = 10 experiments), and pulsed stimulation on cultures with presence of APV/Picrotoxin (n = 10 experiments). (E) Cumulative distribution of average FR during stimulus normalized to average FR before stimulus. (F) Average normalized PSTH over all experiments.
FIGURE 4
FIGURE 4
Changes in the network collective dynamics. Plots on the left side are for pulsed stimulation and the plots on the right side are for the fade-in stimulation. (A,B) Average normalized FR before and after stimulation. Here and in the other panels, the dotted gray line marks the mean before stimulation and the dark blue line marks the mean after stimulation. (C,D) Average normalized intra-burst firing rate (IBFR). (E,F) Average normalized burst rate. (G,H) An example of spontaneous activity before and after stimulation. In all plots, the light blue lines mark the 95% bootstrap confidence interval. The light blue column in all Figures (300 and 380 s) marks the light stimulation period. P values on each plot give the significance level for the increase of FR, burst occurrence rate, or IBFR during the last 5 min of recording, respectively. Results for the pulsed stimulation are averages over 18 experiments in 18 cultures. Results with the fade-in stimulation are averages over 16 experiments in 16 cultures.
FIGURE 5
FIGURE 5
Control experiments. Plots on the left side are corresponding to control experiments of transduced cultures without light stimulation and the plots on the right side are for control experiments on non-transduced cultures stimulated with light. (A,B) Average normalized FR. Here and in the other panels, the dotted gray line marks the mean value of the first 2 min of recording which the activity of the culture is normalized to and the dark blue line marks the mean during the last 2 min of recording. (C,D) Average normalized IBFR. (E,F) Average normalized burst rate. In all plots, the light blue lines mark the 95% bootstrap confidence interval. The light blue column in panels (B,D,F; 120 and 200 s) marks the light stimulation period with pulsed stimulation protocol. P values on each plot give the significance level for the increase of FR, burst occurrence rate, or IBFR during the last 2 min of recording, respectively. Results for the control experiments of transduced cultures without light stimulation are averages over seven experiments in seven cultures. Results with stimulated non-transduced cultures are averages over five experiments in five cultures.
FIGURE 6
FIGURE 6
Changes in network synchronization. (A) Average cross-correlation function of pulsed stimulation, with the blue line representing the average cross-correlation function before stimulation and the green line representing the average-cross correlation function after stimulation. Dotted lines mark Jackknife confidence intervals. The inset represents the long-term dynamics of the average cross-correlation function. (B) Cumulative distributions of burst durations before stimulation (blue line) and after stimulation (green line) of pulsed stimulation. (C) Cross correlation functions of fade-in stimulation. The inset represents the average cross-correlation function on a 1 s timescale. (D) Cumulative distribution of the burst duration before stimulation (blue line) and after stimulation (green line) of fade-in stimulation.
FIGURE 7
FIGURE 7
Network plasticity in the presence of NBQX/Picrotoxin. (A,B) Spontaneous activity (before stimulation) of a neuronal culture before and after adding NBQX/Picrotoxin. (C) Average normalized FR before and after stimulation. Here and in the other panels, the dotted gray line marks the mean before stimulation and the dark blue line marks the mean after stimulation. (D) Normalized average IBFR. (E) Normalized average burst rate. In all plots, the light blue lines mark the 95% bootstrap confidence interval. The light blue column in all figures (300 and 380 s) marks the light stimulation period. P values on each plot give the significance level for the increase of FR, burst occurrence rate, or IBFR during the last 5 min of recording, respectively. The results are averages in 10 experiments in 10 cultures.
FIGURE 8
FIGURE 8
Network plasticity in the presence of APV/Picrotoxin. (A,B) Spontaneous activity (before stimulation) of a neuronal culture before and after adding APV/Picrotoxin. (C) Average normalized FR before and after stimulation Here and in the other panels, the dotted gray line marks the mean before stimulation and the dark blue line marks the mean after stimulation. (D) Normalized average IBFR. (E) Normalized average burst rate. In all plots, the light blue lines mark the 95% bootstrap confidence interval. The light blue column in all figures (300 and 380 s) marks the light stimulation period. P values on each plot give the significance level for the increase of FR, burst occurrence rate, or IBFR during the last 5 min of recording, respectively. The results are averages in 10 experiments in 10 cultures.

Similar articles

Cited by

References

    1. Abraham W., Gustafsson B, Wigström H. (1987). Long-term potentiation involves enhanced synaptic excitation relative to synaptic inhibition in guinea-pig hippocampus. J. Physiol. 394 367–380 - PMC - PubMed
    1. Aizenman C. D., Linden D. J. (2000). Rapid, synaptically driven increases in the intrinsic excitability of cerebellar deep nuclear neurons. Nat. Neurosci. 3 109–11110.1038/72049 - DOI - PubMed
    1. Bakkum D. J., Chao Z. C., Potter S. M. (2008a). Spatio-temporal electrical stimuli shape behavior of an embodied cortical network in a goal-directed learning task. J. Neural Eng. 5 310–32310.1088/1741-2560/5/3/004 - DOI - PMC - PubMed
    1. Bakkum D. J., Chao Z. C., Potter S. M. (2008b). Long-term activity-dependent plasticity of action potential propagation delay and amplitude in cortical networks. PLoS ONE 3:e2088 10.1371/journal.pone.0002088 - DOI - PMC - PubMed
    1. Battaglia D., Witt A., Wolf F., Geisel T. (2012). Dynamic effective connectivity of inter-areal brain circuits. PLoS Comput. Biol. 8:e1002438 10.1371/journal.pcbi.1002438 - DOI - PMC - PubMed

Publication types