. 2013 Oct 22:7:169.
doi: 10.3389/fncir.2013.00169. eCollection 2013.

Activation of high and low affinity dopamine receptors generates a closed loop that maintains a conductance ratio and its activity correlate

Affiliations

Activation of high and low affinity dopamine receptors generates a closed loop that maintains a conductance ratio and its activity correlate

Wulf-Dieter C Krenz et al. Front Neural Circuits. .

Abstract

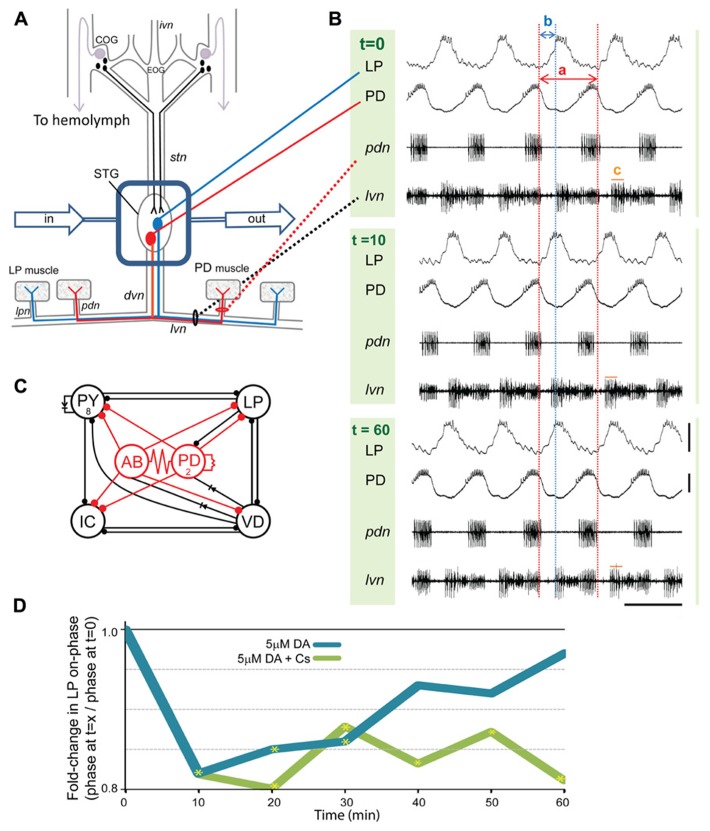
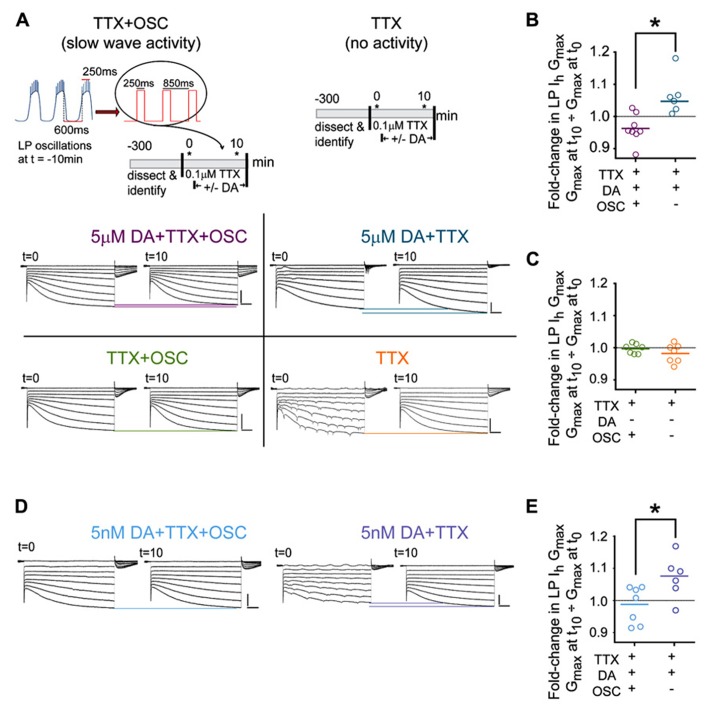
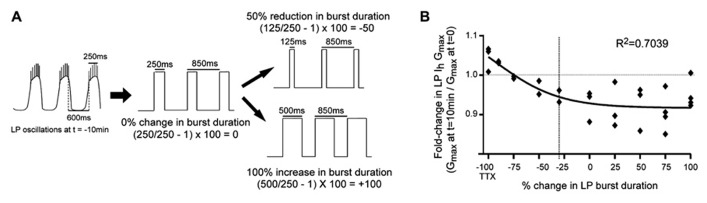
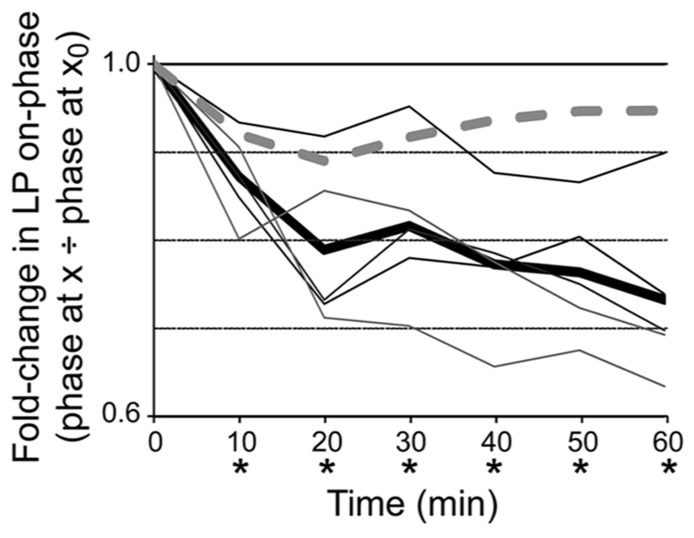
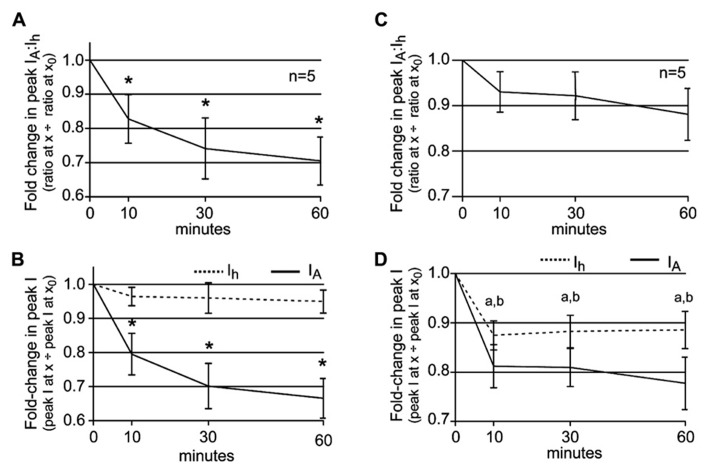
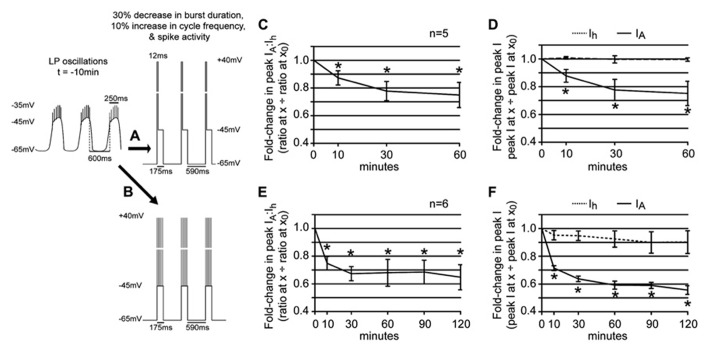
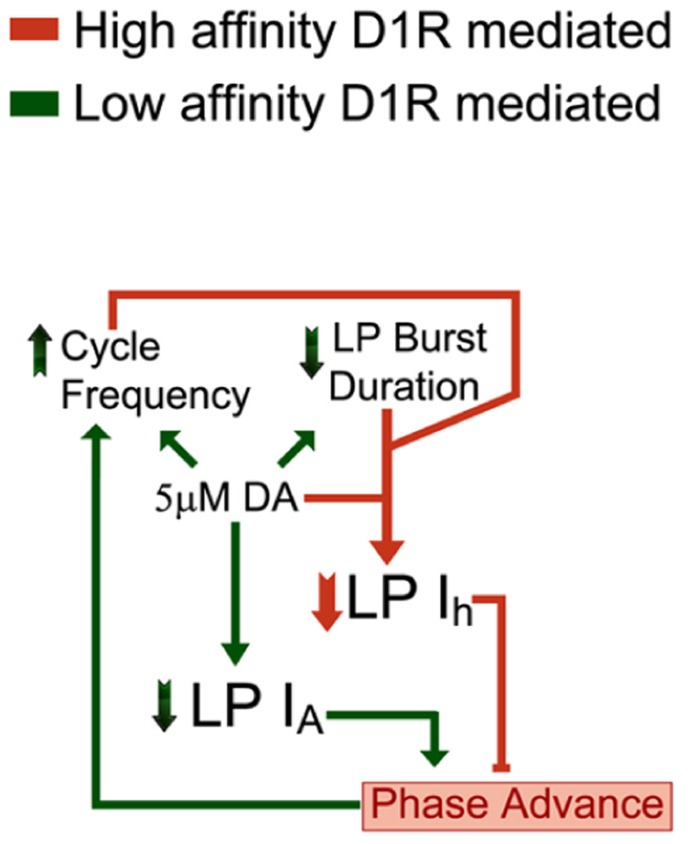
Neuromodulators alter network output and have the potential to destabilize a circuit. The mechanisms maintaining stability in the face of neuromodulation are not well described. Using the pyloric network in the crustacean stomatogastric nervous system, we show that dopamine (DA) does not simply alter circuit output, but activates a closed loop in which DA-induced alterations in circuit output consequently drive a change in an ionic conductance to preserve a conductance ratio and its activity correlate. DA acted at low affinity type 1 receptors (D1Rs) to induce an immediate modulatory decrease in the transient potassium current (IA) of a pyloric neuron. This, in turn, advanced the activity phase of that component neuron, which disrupted its network function and thereby destabilized the circuit. DA simultaneously acted at high affinity D1Rs on the same neuron to confer activity-dependence upon the hyperpolarization activated current (Ih) such that the DA-induced changes in activity subsequently reduced Ih. This DA-enabled, activity-dependent, intrinsic plasticity exactly compensated for the modulatory decrease in IA to restore the IA:Ih ratio and neuronal activity phase, thereby closing an open loop created by the modulator. Activation of closed loops to preserve conductance ratios may represent a fundamental operating principle neuromodulatory systems use to ensure stability in their target networks.

Keywords: HCN channel; activity-dependent intrinsic plasticity; metamodulation; metaplasticity; pyloric network; stomatogastric.


Figures

FIGURE 1
FIGURE 1
Phase recovery in the pyloric network. (A) In situ preparation: the stomatogastric nervous system (STNS) is dissected and pinned in a dish. The commissural ganglia (CoGs) contain DA neurons that project to the STG (black) and L-cells, which are the source of neurohormonal DA (purple). The well surrounding the STG (blue rectangle) is continuously superfused with saline (in/out arrows). There are ~30 neurons in the STG. The pyloric network comprises 14 STG neurons; two are drawn: pyloric dilator (PD, red), lateral pyloric (LP, blue). Network neurons interact locally within the STG and can project axons to striated muscles surrounding the foregut. The diagram shows that PD and LP neurons project their axons through identified nerves to innervate muscles (rectangles). (B) Spontaneous pyloric network output from one experiment during a 1 h 5 μM DA application: one set of traces comprises two intra-cellular recordings (top) and two extra-cellular recordings (bottom) from the in situ preparation diagrammed in (A). The three sets of traces represent recordings from the indicated time points, in minutes, directly before and after the start of DA application. Red and blue dashed lines reveal how cycle period and LP-on delay change with time. The two red lines demarcate one cycle. Cycle period (a) is defined as the time between the last spike in one PD burst and the last spike in the subsequent PD burst. Note that for each time point the last spike in the first PD burst is aligned with the first red line; however, the last spike in the second PD burst is not aligned with the second red line except at t = 0. This is because 5 μM DA produces a sustained average 10% reduction in cycle period. Thus, for t = 10 and 60 min, the spike in the second PD burst occurs prior to the second red line. Within the indicated cycle, a blue line aligns with the first spike in LP at t = 0. The time between the last spike in PD and the first spike in LP (b) represents LP-on delay, and LP-on phase is: b/a. Note that for the t = 10 min cycle, the first spike in LP occurs well before the blue line. This is because DA produces an average~20% LP-on phase advance. LP-on phase recovery can be seen in the cycle at t = 60 min because the first LP spike is again aligned with the blue line. Measures of pyloric output parameters can be obtained from either intra- or extra-cellular traces, and LP burst duration is indicated by (c) on the extracellular traces; scale bars: 20 mV and 500 ms. (C) The pyloric circuit: the diagram represents pyloric neuron interactions within the STG. Open circles represent the six cell types, numbers indicate more than one cell within a cell type: anterior burster (AB), inferior cardiac (IC), ventricular dilator (VD); filled circles, inhibitory chemical synapses; resistors and diodes, electrical coupling; red, pacemaker kernel and its output connections. (D) Phase recovery: the preparation shown in (A) was superfused with one of the two indicated treatments for 1 h and LP on-phase was measured every 10 min throughout the experiment (n ≥ 6/treatment). Average fold-changes in LP on-phase are plotted for each group; yellow asterisks, significantly different from t = 0, data taken from Rodgers et al. (2011a). Note that phase recovery in 5 μM DA was blocked by Cs.
FIGURE 2
FIGURE 2
DA-enables activity-dependent alterations in LP Ih. (A) The protocols used to measure DA- and/or activity-induced changes in LP Ih are diagramed in the top two panels. Asterisks indicate points where TEVC measures of LP Ih were made. Bottom panels show typical LP Ih recordings at t = 0 and t = 10 min for each of the four the indicated treatment groups; scale bars: 500 ms and 5 nA. Note that distal compartments of LP neurons are not completely space clamped and oscillatory activity at t = 0 was observed in all treatment groups in ~20% of the experiments due to the short exposure to TTX (example seen in TTX group); nevertheless, Ih could be measured from the traces. (B,C) Plots of the fold-changes in LP Ih Gmax in each treatment group at t = 10 min. Each symbol represents one experiment; solid lines indicate the means; *p < 0.05, t-tests. (D) Typical LP Ih recordings for additional experiments in 5 nM DA. (E) Plots of the fold-changes in LP Ih Gmax in each treatment group in 5 nM DA at t = 10 min. Each symbol represents one experiment; solid lines represent means *p < 0.05, t-test.
FIGURE 3
FIGURE 3
LP Ih activity-dependence curve in 5 μM DA. (A) Experimental protocol: TEVC was used to create a recurring voltage step that mimicked slow wave activity at t = -10 min, except the length of the depolarizing step varied across experiments to alter burst duration. Examples are shown for how the length of the step corresponded to no change, a reduction or an increase in burst duration. There was no change in cycle period. (B) Plot of fold-changes in LP Ih Gmax for the 10 min time point; -100 on the x-axis represents experiments in TTX without a recurring step; vertical dashed line marks 30% reduction in burst duration (i.e., average 5 μM DA-induced change) each diamond represents one experiment; data were fitted with a Boltzmann sigmoidal equation.
FIGURE 4
FIGURE 4
DAD regulation of LP Ih is necessary for phase recovery in 5 μM. Plots of fold-changes in LP-on phase over time for dynamic clamp (solid lines) and control (dashed line) experiments indicate that introduction of a dynamic clamp current to abrogate DAD regulation of LP Ih prevents phase recovery; thin lines, individual experiments with dynamic clamp (n = 5); thick line, average for experiments with dynamic clamp; dashed line, control experiment that was exactly the same as the dynamic clamp experiments except that the dynamic clamp was turned off during the 1 h superfusion with 5 μM DA. Repeated measures ANOVA with Dunnett’s post hoc tests that compared all time points to t = 0 showed that average LP-on phase did not recover in experimental preparations, F(6,4) = 16.04, p < 0.0001; *p < 0.05. Note that phase did recover in the control experiment.
FIGURE 5
FIGURE 5
The LP IA:Ih ratio is maintained in 5 μM DA when DA application is accompanied by DA-induced changes in slow wave activity. (A) A plot of the fold-changes in the LP IA:Ih ratio (mean ± SEM) throughout a 1 h superfusion with 5 μM DA and implementation of a recurring voltage step that mimicked the DA-induced 30% decrease in LP burst duration, but no change in cycle frequency. The ratio significantly decreased with time; repeated measures ANOVA with Dunnett’s post hoc tests that compare all time points to t = 0, F(3,4) = 7.322, p = 0.0032. (B) Plots of the fold-changes in peak LP IA and Ih (mean ± SEM) from the same experiments as in (A). Repeated measures ANOVAs with Dunnett’s post hoc tests that compare all time points to t = 0 indicate that only LP IA was significantly decreased [LP IA: F(3,4) = 19.66, p < 0.0001; LP Ih, F(3,4) = 1.218, p = 0.3456]. *p < 0.05. (C) Plot of the fold-changes in the LP IA:Ih ratio (mean ± SEM) throughout a 1 h superfusion with 5 μM DA and implementation of a recurring voltage step that mimicked the DA-induced 30% decrease in LP burst duration and a 10% increase in cycle frequency. The ratio did not change significantly over time (repeated measures ANOVA, see text). (D) Plots of the fold-changes in peak LP IA and Ih (mean ± SEM) from the same experiments as in (C) show that both currents are stably altered by 10 min; a and b indicate a significant change in LP IA and Ih, respectively, based on repeated measures ANOVA with Dunnett’s post hoc tests that compare all time points to t = 0, p < 0.05 (see text).
FIGURE 6
FIGURE 6
Spike activity influences the LP IA:Ih ratio in 5 μM DA. (A,B) Diagrams of recurrent voltage steps that were applied during 5 μM DA application. Spikes are not drawn to scale. Note the recurrent step mimicked the DA-induced decrease in LP burst duration and cycle period. In addition, it mimicked spike activity. In (A), spike activity is represented as a single depolarizing step to +40 mV. The duration of the step = 6 spikes × 2 ms = 12 ms. In (B), the six spikes are represented as 6, 2 ms depolarizations to +40 mV. The time between each depolarization is 0.66 x average ISI in ms at t = -10 min. (C) Plot of the fold-changes in the LP IA:Ih ratio (mean ± SEM) throughout a 1 h superfusion with 5 μM DA and implementation of the recurrent voltage step indicated by protocol A. The ratio significantly decreased with time; *p < 0.05, repeated measures ANOVA with Dunnett’s post hoc tests that compare all time points to t = 0 (see text). (D) Plots of the fold-changes in peak LP IA and Ih (mean ± SEM) from the same experiments as in (C); *p < 0.05 for IA only, repeated measures ANOVAs with Dunnett’s post hoc tests (see text). (E) Plot of the fold-changes in the LP IA:Ih ratio (mean ± SEM) throughout a 2 h superfusion with 5 μM DA and implementation of a recurring voltage step indicated by protocol B. The ratio significantly decreased with time; *p < 0.05, repeated measures ANOVA with Dunnett’s post hoc tests that compare all time points to t = 0, F(5,4) = 8.728, p = 0.0002. (F) Plots of the fold-changes in peak LP IA and Ih (mean ± SEM) from the same experiments as in (E). Note that although LP Ih is slowly reduced, repeated measures ANOVAs with Dunnett’s post hoc tests that compare all time points to t = 0 indicate that only the decrease in LP IA is statistically significant [LP IA: F(3,4) = 19.66, p < 0.0001; LP Ih, F(3,4) = 1.218, p = 0.3456]; *p < 0.05.
FIGURE 7
FIGURE 7
DA (5 μM) activates a closed loop. DA (5 μM) acts at high affinity D1Rs to confer activity-dependence upon LP Ih (DAD regulation, coral). In addition, 5 μM DA acts at low affinity D1Rs to modulate LP IA and circuit output (DA modulation, green). Note that the D1R high affinity (coral) and low affinity (green) effects each provide an arm of a closed loop. DA (5 μM) initially increases network cycle frequency, decreases LP burst duration and advances LP activity phase. The latter is due to a decrease in LP IA. The phase advance not only prevents LP network function, which is to act as a brake on increasing cycle frequencies, but may even drive further increases in cycle frequency. DAD regulation permits these DA-induced changes in activity to subsequently produce a compensatory decrease in LP Ih Gmax. This restores the LP IA:Ih conductance ratio and the timing of LP activity phase at the increased cycle frequency and decreased burst duration. This will stabilize circuit output by limiting further increases in cycle frequency.

References

    1. Ballo A. W., Nadim F., Bucher D. (2012). Dopamine modulation of Ih improves temporal fidelity of spike propagation in an unmyelinated axon. J. Neurosci. 32 5106–5119 10.1523/JNEUROSCI.6320-11.2012 - DOI - PMC - PubMed
    1. Baro D. J., Ayali A., French L., Scholz N. L., Labenia J., Lanning C. C., et al. (2000). Molecular underpinnings of motor pattern generation: differential targeting of shal and shaker in the pyloric motor system. J. Neurosci. 20 6619–6630 - PMC - PubMed
    1. Baro D. J., Levini R. M., Kim M. T., Willms A. R., Lanning C. C., Rodriguez H. E., et al. (1997). Quantitative single-cell-reverse transcription-PCR demon-strates that A-current magnitude varies as a linear function of shal gene expression in identified stomatogastric neurons. J. Neurosci. 17 6597–6610 - PMC - PubMed
    1. Bose A., Manor Y., Nadim F. (2004). The activity phase of postsynaptic neurons in a simplified rhythmic network. J. Comput. Neurosci. 17 245–261 10.1023/B:JCNS.0000037685.71759.1a - DOI - PubMed
    1. Bucher D., Prinz A. A., Marder E. (2005). Animal-to-animal variability in motor pattern production in adults and during growth. J. Neurosci. 25 1611–1619 10.1523/JNEUROSCI.3679-04.2005 - DOI - PMC - PubMed

Publication types

MeSH terms

LinkOut - more resources