. 2013 Oct 21:7:35.
doi: 10.3389/fnana.2013.00035. eCollection 2013.

Distribution of neurons in functional areas of the mouse cerebral cortex reveals quantitatively different cortical zones

Affiliations

Distribution of neurons in functional areas of the mouse cerebral cortex reveals quantitatively different cortical zones

Suzana Herculano-Houzel et al. Front Neuroanat. .

Abstract

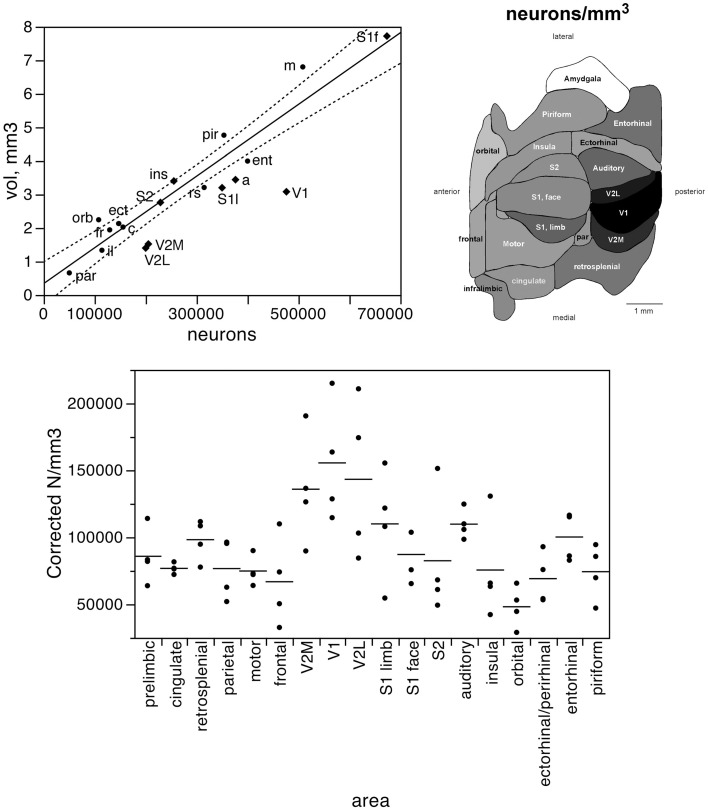
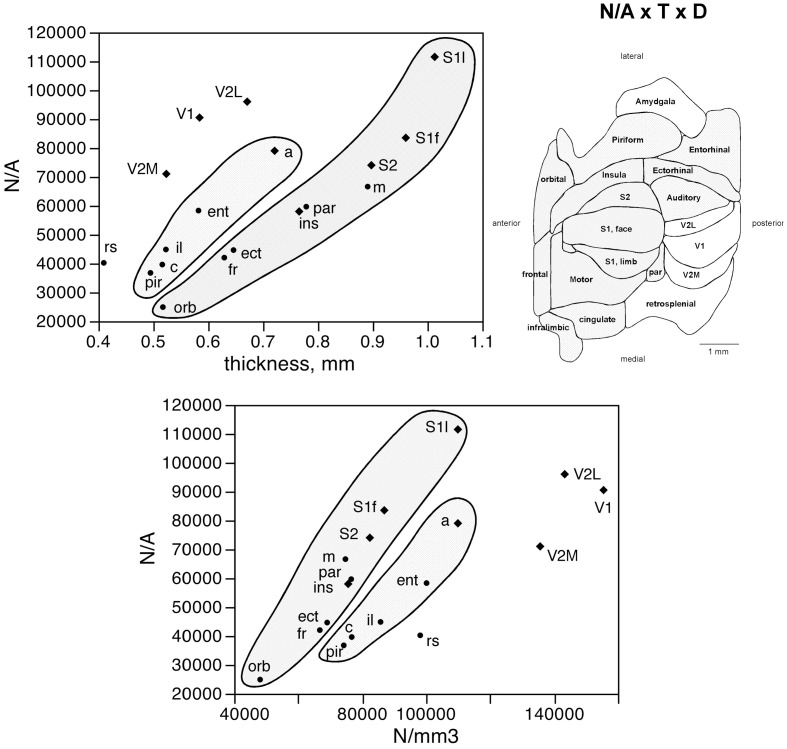
How are neurons distributed along the cortical surface and across functional areas? Here we use the isotropic fractionator (Herculano-Houzel and Lent, 2005) to analyze the distribution of neurons across the entire isocortex of the mouse, divided into 18 functional areas defined anatomically. We find that the number of neurons underneath a surface area (the N/A ratio) varies 4.5-fold across functional areas and neuronal density varies 3.2-fold. The face area of S1 contains the most neurons, followed by motor cortex and the primary visual cortex. Remarkably, while the distribution of neurons across functional areas does not accompany the distribution of surface area, it mirrors closely the distribution of cortical volumes-with the exception of the visual areas, which hold more neurons than expected for their volume. Across the non-visual cortex, the volume of individual functional areas is a shared linear function of their number of neurons, while in the visual areas, neuronal densities are much higher than in all other areas. In contrast, the 18 functional areas cluster into three different zones according to the relationship between the N/A ratio and cortical thickness and neuronal density: these three clusters can be called visual, sensory, and, possibly, associative. These findings are remarkably similar to those in the human cerebral cortex (Ribeiro et al., 2013) and suggest that, like the human cerebral cortex, the mouse cerebral cortex comprises two zones that differ in how neurons form the cortical volume, and three zones that differ in how neurons are distributed underneath the cortical surface, possibly in relation to local differences in connectivity through the white matter. Our results suggest that beyond the developmental divide into visual and non-visual cortex, functional areas initially share a common distribution of neurons along the parenchyma that become delimited into functional areas according to the pattern of connectivity established later.

Keywords: cortical development; mouse; neuronal density; numbers of neurons; occipital cortex; visual cortex.


Figures

Figure 1
Figure 1
Distribution of absolute and relative numbers of neurons (left) and other cells (right) across the 18 functional areas of the mouse cerebral cortex. Functional areas are drawn according to their surface reconstruction from Franklin and Paxinos (2007). Gray levels represent absolute and relative numbers of neurons or other cells normalized to the maximal values (100%, that is, black, found in the S1 face area). Absolute and relative numbers of cells are found in Table 1.
Figure 2
Figure 2
The volume of each functional area varies as a simple shared function of the number of neurons in each area, with the exception of the visual areas. Top left, area volume plotted as a function of the average number of neurons found in that functional area. The fitted line is the linear function that describes the entire dataset, including areas V1, V2L, and V2M, whose respective datapoints fall well outside of the 95% confidence interval (dotted lines). Top right, variation in average neuronal density (neurons/mm3) across functional areas. Gray levels represent neuronal density normalized by the maximal value, observed in area V1 (100%, that is, black). Bottom, variation in neuronal density across functional areas and across individuals. Horizontal lines indicate the average neuronal density found in each functional area.
Figure 3
Figure 3
The relative number of cortical neurons found in each functional area correlates well with the relative volume of each area, but poorly with the relative surface area of each functional area. Top left, relative number of cortical neurons in each area plotted as a function of the relative volume of that functional area. The fitted line is the linear function that describes the entire dataset, including areas V1, V2L, and V2M, whose respective datapoints fall well outside of the 95% confidence interval (dotted lines). Top right, variation in cortical volume (absolute and relative) across functional areas. Gray levels represent normalized cortical volume. Bottom left, relative number of cortical neurons in each area plotted as a function of the relative surface area of that functional area. The fitted line is the linear function that describes the entire dataset, with the 95% confidence interval indicated by the dotted lines. Bottom right, variation in cortical surface area (absolute and relative) across functional areas. Gray levels represent normalized cortical surface.
Figure 4
Figure 4
The surface area of each functional area is not tightly correlated to the number of neurons in each area. Top left, surface area of each functional area plotted as a function of the average number of neurons found in that functional area. The fitted line is the linear function that describes the entire dataset, with the 95% confidence interval indicated by the dotted lines. Top right, variation in average surface density of neurons (neurons/mm2, or N/A) across functional areas. Gray levels represent surface density of neurons normalized by the maximal value, observed in area S1limb. Bottom, variation in surface density of neurons (neurons/area, or N/A, in neurons/mm2) across functional areas and across individuals. Horizontal lines indicate the average surface density of neurons found in each functional area.
Figure 5
Figure 5
Cortical thickness is not a simple function of the number of neurons across functional areas. Top left, average thickness of each functional area plotted as a function of the average number of neurons found in that functional area. There is no significant correlation between the two variables (p = 0.2798). Top right, variation in average thickness of the gray matter of each functional area. Gray levels represent average thickness normalized by the maximal value, observed in area S1limb. Bottom, average thickness of each functional area plotted as a function of the average neuronal density in that functional area. Notice that datapoints segregate into three clusters (indicated); within each cluster, variations in cortical thickness are tightly correlated to variations in neuronal density across functional areas.
Figure 6
Figure 6
Surface density of neurons (N/A) varies with cortical thickness and neuronal density in different ways across three cortical zones. Top left, average surface density of neurons (N/A, in neurons/mm2) in each functional area plotted as a function of the average thickness of the gray matter in that functional area. Datapoints segregate into three clusters (indicated); within each cluster, variations in N/A are tightly correlated to variations in cortical thickness across functional areas. Top right, shading indicates the clustering of functional areas into the three zones indicated in the graphs according to the relationships between N/A and cortical thickness or neuronal density. Bottom, average surface density of neurons (N/A, in neurons/mm2) in each functional area plotted as a function of the average neuronal density in that functional area. Notice the segregation of the datapoints into the same three clusters (indicated); within each cluster, variations in N/A are tightly correlated to variations in neuronal density across functional areas.
Figure 7
Figure 7
The volume of each functional area varies as a simple shared function of the number of other cells in each area. Top left, area volume plotted as a function of the average number of other cells found in that functional area. The fitted line is the linear function that describes the entire dataset, and the dotted lines indicate the 95% confidence interval of the fitted function. Top right, variation in average other cell density (other cells/mm3) across functional areas. Gray levels represent neuronal density normalized by the maximal value, observed in the retrosplenial cortex. Bottom, variation in other cell density across functional areas and across individuals. Horizontal lines indicate the average other cell density found in each functional area.
Figure 8
Figure 8
The relative number of cortical other cells found in each functional area correlates well with both the relative volume and the relative surface area of each functional area. Top, relative number of cortical other cells in each area plotted as a function of the relative volume of that functional area. Bottom, relative number of cortical other cells in each area plotted as a function of the relative surface area of that functional area. The fitted lines are the linear functions that describe the entire dataset; the 95% confidence intervals are indicated by the dotted lines.
Figure 9
Figure 9
Local variations in the distribution of other cells under the cortical surface (O/A) are tightly linked to local variations in the distribution of neurons under the cortical surface (N/A) but not to variations in cortical thickness. Top, other cells per mm2 of cortical surface (O/A) in each area plotted as a function of the number of neurons per mm2 in the same area (N/A). Bottom, other cells per mm2 of cortical surface (O/A) in each area plotted as a function of thickness of the grey matter in the same area. The fitted lines are the linear functions that describe the entire dataset.
Figure 10
Figure 10
Rules governing the distribution of other cells across cortical areas. Top, average density of other cells in each area plotted as a function of the average density of neurons in that functional area. There is a tight correlation between the two densities across functional areas divided into two clusters: one including the sensory and motor areas and motor cortex (shaded area) and another including the remaining cortical areas. Bottom, ratio between other cells and neurons (O/N) plotted as a function of the average neuronal density in each functional area. The fitted line is the power function of exponent −0.330 that describes the entire dataset.

Similar articles

Cited by

References

    1. Bachler M., Neübuser A. (2001). Expression of members of the Fgf family and their receptors during midfacial development. Mech. Dev. 100, 313–316 10.1016/S0925-4773(00)00518-9 - DOI - PubMed
    1. Benavides-Piccione R., Hamzei-Sichani F., Ballesteros-Yanez I., Defelipe J., Yuste R. (2006). Dendritic size of pyramidal neurons differs among mouse cortical regions. Cereb. Cortex 16, 990–1001 10.1093/cercor/bhj041 - DOI - PubMed
    1. Bianchi S., Stimpson C. D., Bauernfeind A. L., Schapiro S. J., Baze W. B., McArthur M. J., et al. (2012). Dendritic morphology of pyramidal neurons in the chimpanzee neocortex: regional specializations and comparison to humans. Cereb. Cortex 23, 2429–2436 10.1093/cercor/bhs239 - DOI - PMC - PubMed
    1. Bishop K. M., Goudreau G., O'Leary D. D. (2000). Regulation of area identity in the mammalian neocortex by Emx2 and Pax6. Science 288, 344–349 10.1126/science.288.5464.344 - DOI - PubMed
    1. Cahalane D. J., Charvet C. J., Finlay B. F. (2012). Systematic, balancing gradients in neuron density and number across the primate isocortex. Front. Neuroanat. 6:28 10.3389/fnana.2012.00028 - DOI - PMC - PubMed

LinkOut - more resources