. 2013 Oct 14;8(10):e77098.
doi: 10.1371/journal.pone.0077098. eCollection 2013.

Involvement of miRNAs in the differentiation of human glioblastoma multiforme stem-like cells

Affiliations

Involvement of miRNAs in the differentiation of human glioblastoma multiforme stem-like cells

Beatriz Aldaz et al. PLoS One. .

Abstract

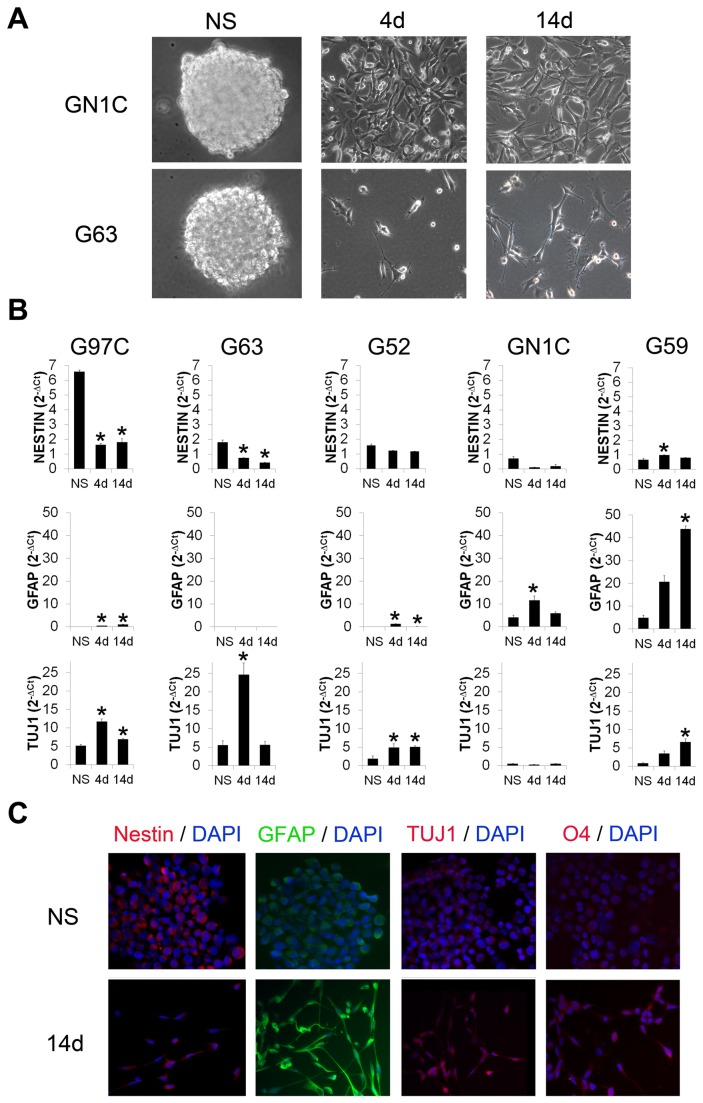
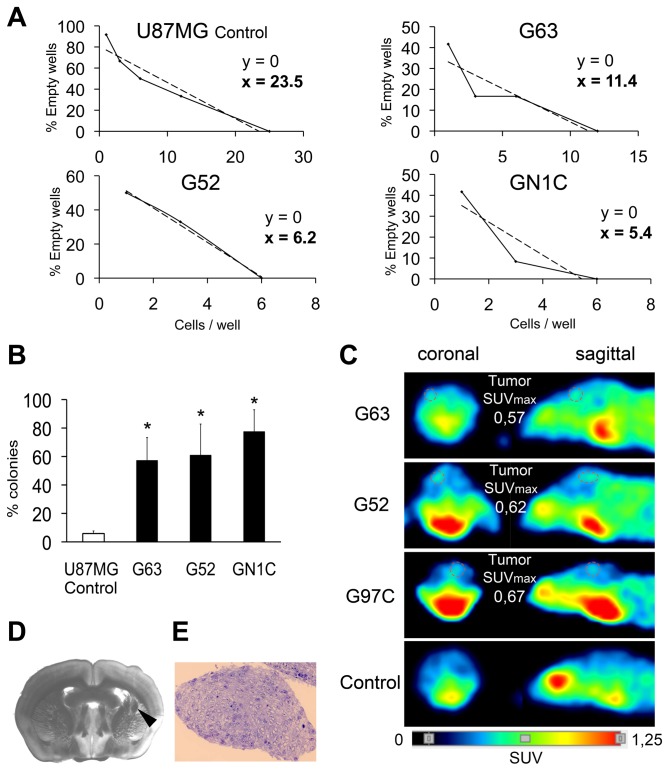
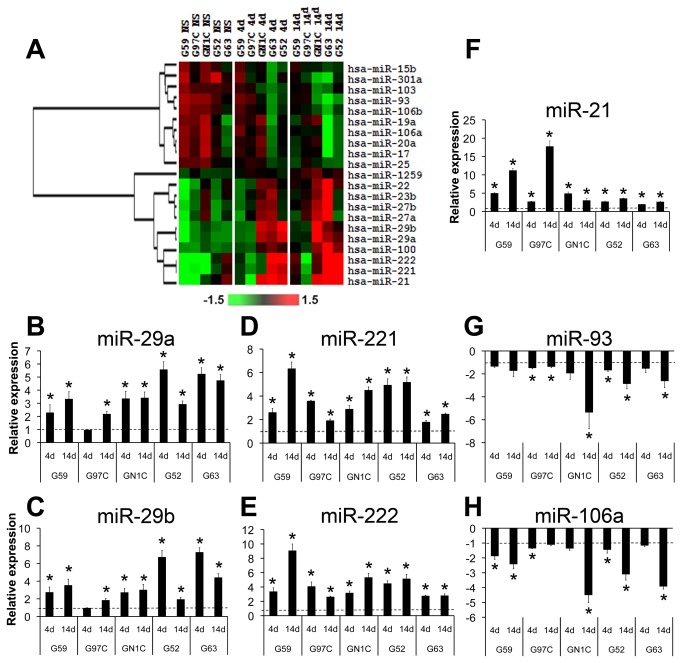
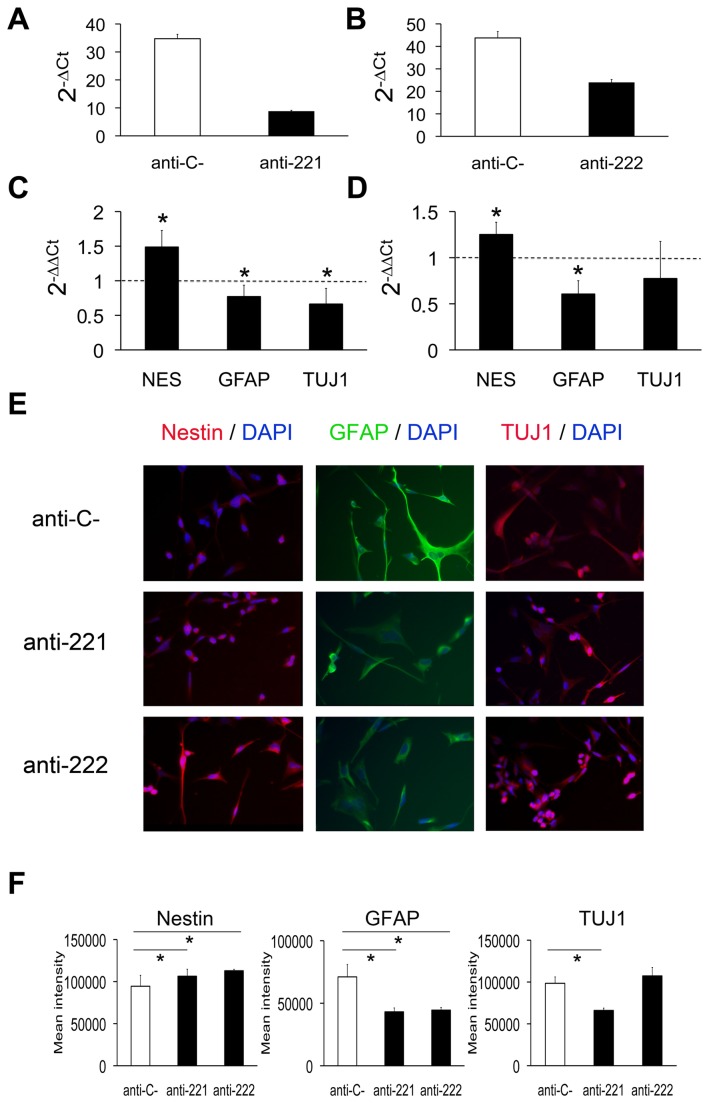
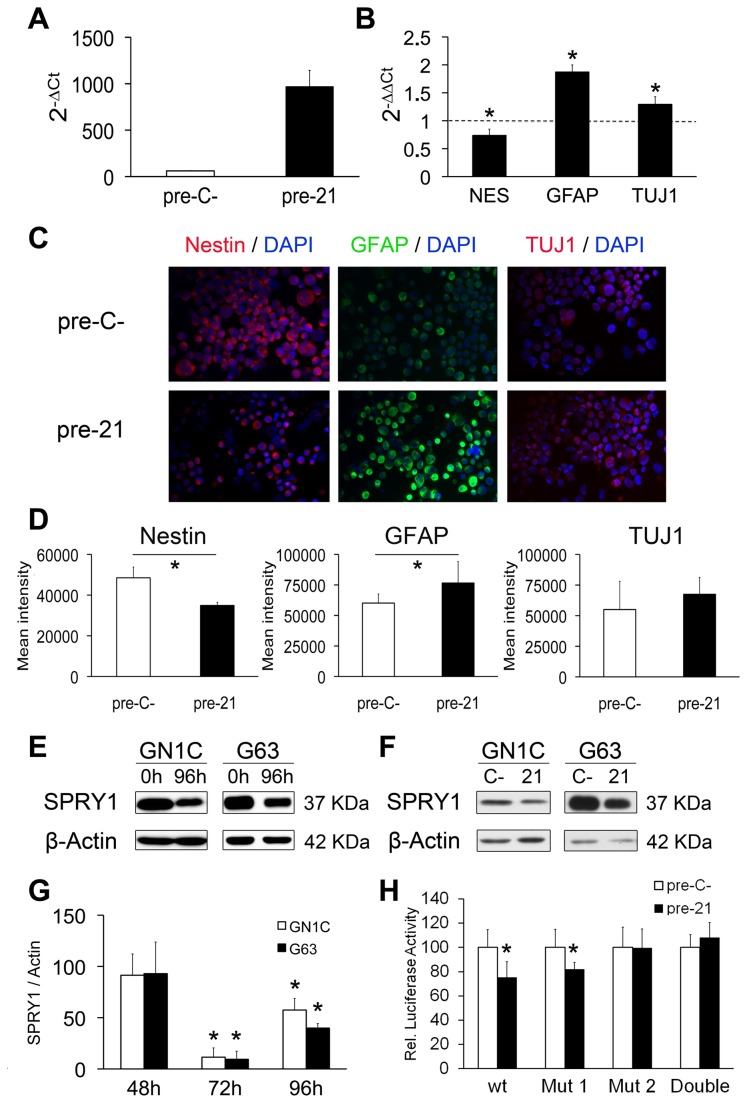
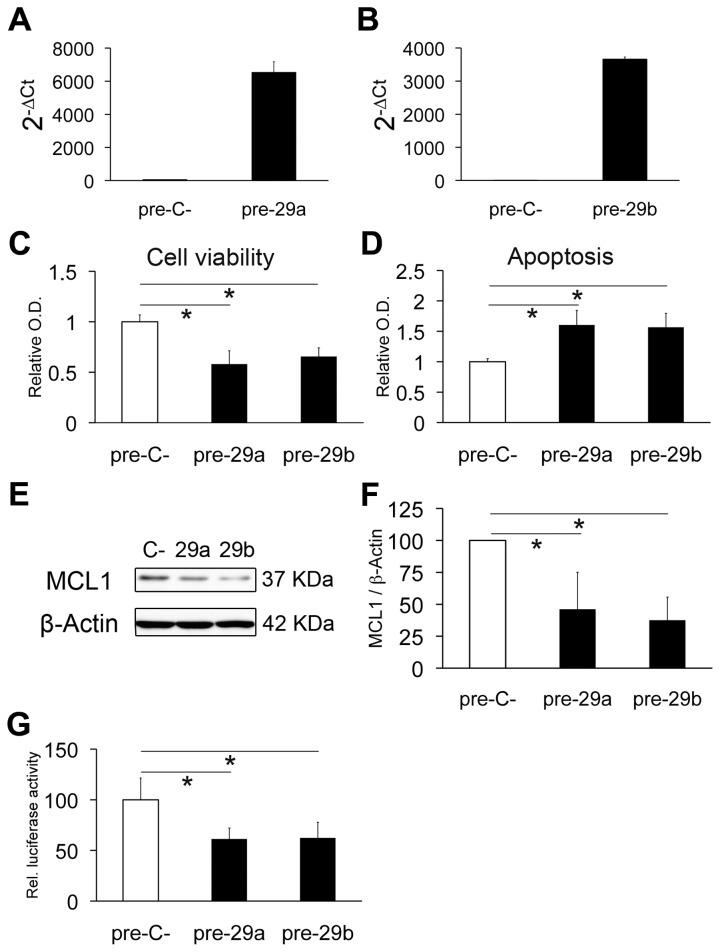
Glioblastoma multiforme (GBM)-initiating cells (GICs) represent a tumor subpopulation with neural stem cell-like properties that is responsible for the development, progression and therapeutic resistance of human GBM. We have recently shown that blockade of NFκB pathway promotes terminal differentiation and senescence of GICs both in vitro and in vivo, indicating that induction of differentiation may be a potential therapeutic strategy for GBM. MicroRNAs have been implicated in the pathogenesis of GBM, but a high-throughput analysis of their role in GIC differentiation has not been reported. We have established human GIC cell lines that can be efficiently differentiated into cells expressing astrocytic and neuronal lineage markers. Using this in vitro system, a microarray-based high-throughput analysis to determine global expression changes of microRNAs during differentiation of GICs was performed. A number of changes in the levels of microRNAs were detected in differentiating GICs, including over-expression of hsa-miR-21, hsa-miR-29a, hsa-miR-29b, hsa-miR-221 and hsa-miR-222, and down-regulation of hsa-miR-93 and hsa-miR-106a. Functional studies showed that miR-21 over-expression in GICs induced comparable cell differentiation features and targeted SPRY1 mRNA, which encodes for a negative regulator of neural stem-cell differentiation. In addition, miR-221 and miR-222 inhibition in differentiated cells restored the expression of stem cell markers while reducing differentiation markers. Finally, miR-29a and miR-29b targeted MCL1 mRNA in GICs and increased apoptosis. Our study uncovers the microRNA dynamic expression changes occurring during differentiation of GICs, and identifies miR-21 and miR-221/222 as key regulators of this process.


Conflict of interest statement

Competing Interests: We declare that co-authors Jose Angel Martinez-Climent and Marta M. Alonso are PLOS ONE Editorial Board members. This does not alter our adherence to all the PLOS ONE policies on sharing data and materials.

Figures

Figure 1
Figure 1. The GBM neurosphere cultures express neuronal and astrocytic differentiation markers upon in vitro induced differentiation.
Morphology of two representative NS cell lines, GN1C and G63, is shown at their basal state of NS (A, left panels) and after induction of their differentiation for 4 (4d) (A, central panels) and 14 days (14d) (A, right panels). All images were captured using an inverted optical microscope Leica DMIRB with 20X magnification. Expression of progenitor (Nestin), astrocytic (GFAP) and neuronal (TUJ1) markers was measured by q-RT-PCR in the NS cell lines G59, G97C, G63, G52 and GN1C (B) at the basal NS state and upon 4 (4d) or 14 (14d) days of induction of differentiation. Data were normalized to GAPDH expression as 2-ΔCt. * indicates statistical p value <0.05 using unpaired t-test with the Holm-Bonferroni correction for multiple comparisons. Protein expression of Nestin, GFAP and TUJ1, as well as the presence of the oligodendrocytic sulfatide marker O4 (C), were analyzed by immunofluorescence in the GN1C cell line at the NS state (NS) and after 14 days (14d) of differentiation using secondary antibodies conjugated to FITC (green) or Texas Red (red) counterstained with DAPI (blue). Images were acquired at 20X magnification with a 739CCD camera coupled to an Axio Imager Z1 microscope (Carl Zeiss Inc.) using the Isis Imaging System software.
Figure 2
Figure 2. The NS cultures are enriched in GICs when compared to the glioblastoma cell line U87MG.
In vitro self-renewal limiting dilution assays, performed in 12 wells per dilution in triplicate experiments (A), and clonogenic assays, performed in quadruplicate 96-well plates (B) for three NS cell lines: G63, G52 and GN1C; as well as for the U87MG cell line, used as a negative control, are depicted. * indicates statistical p value <0.05 using unpaired t-test with the Holm-Bonferroni correction for multiple comparisons. Tumors obtained from in vivo xenografts (1x10⁶ cells injection) in the brain striatum of BALB/c-Rag2-/--IL2γc-/- mice (n=6 per cell line) were detected using microPET and are shown circled by a dotted line (C). Tumor images corresponding to G63, G52 and G97C xenografts, as well as a negative control brain, are displayed, along with the corresponding quantification of maximum value of standardized caption (SUVmax). A coronal section (200 mm thick) of a tumor originated by G97C was observed by means of a stereoscopic microscope (D) for tumor localization (black arrowhead) and a semi-thin section of the tumor was stained with hematoxylin-eosin (E).
Figure 3
Figure 3. Microarray profiling of miRNA expression during NS differentiation.
A heat map of a hierarchical clustering analysis of the microRNAs with differential expression between the NS cell lines at their basal state (NS) and after 4 (4d) and 14 (14d) days of induction of differentiation is displayed (A). Expression data are represented as log2Ratio and were mean centered for each miRNA. Validation of the differential expression of miR-29a (B), miR-29b (C), miR-221 (D), miR-222 (E), miR-21 (F), miR-93 (G) and miR-106a (H) was carried out by q-RT-PCR using specific TaqMan microRNA assays, normalizing their expression values with respect to RNU6B levels and to the NS state by calculating 2-ΔΔCt. * indicates statistical p value <0.05 using unpaired t-test with the Holm-Bonferroni correction for multiple comparisons; dotted lines indicate the basal expression level at the NS state.
Figure 4
Figure 4. Inhibition of miR-221/222 in differentiating GICs increases Nestin expression and decreases GFAP and TUJ1 levels.
miR-221 and miR-222 inhibition in GN1C cells growing in differentiation medium was carried out with specific anti-miRs and was confirmed by q-RT-PCR 14 days after transfection, compared to cells transfected with anti-miR negative control (anti-C-) (A, B). The expression of miR-221 and miR-222 was normalized with respect to RNU6B as 2-ΔCt. The expression of the progenitor marker Nestin (NES) as well as of astrocytic (GFAP) and neuronal (TUJ1) differentiation markers was also measured by q-RT-PCR and normalized with respect to GAPDH and to the cells transfected in parallel with the anti-miR negative control as 2-ΔΔCt (C, D). Transfections were carried out in triplicate. Dotted lines indicate the expression level of GN1C cells transfected with anti-miR negative control. The corresponding protein expression levels of Nestin, GFAP and TUJ1 were visualized by immunofluorescence (E) using antibodies conjugated to FITC (green) or Texas Red (red) counterstained with DAPI (blue). Images were acquired at 20X magnification with a 739CCD camera coupled to an Axio Imager Z1 microscope (Carl Zeiss Inc.) using the Isis Imaging System software. Quantification of mean intensity for Nestin, GFAP and TUJ1 fluorescence is displayed (F). * indicates p value <0.05 using unpaired t-test or Mann-Whitney U test for statistical analysis and the Holm-Bonferroni correction for multiple comparisons.
Figure 5
Figure 5. miR-21 over-expression in GICs induces GFAP expression, decreases Nestin levels and targets SPRY1.
miR-21 over-expression was analyzed by q-RT-PCR 7 days after transfection and growth in NS medium (A). 2-ΔCt was calculated as miR-21 expression relative to RNU6B expression for GN1C cells transfected with pre-miR negative control (pre-C-) or miR-21 precursor (pre-21). mRNA expression levels of Nestin (NES) as well as astrocytic (GFAP) and neuronal (TUJ1) differentiation markers were measured by q-RT-PCR (B). 2-ΔΔCt was calculated relative to GAPDH expression and GN1C cells transfected with pre-miR negative control (dotted lines). Transfections were carried out in triplicate. Protein expression levels of Nestin, GFAP and TUJ1 were visualized by immunofluorescence (C), 7 days after transfection of GN1C cells with miR-21 precursor (pre-21) or pre-miR negative control (pre-C-). Images were acquired at 20X magnification with a 739CCD camera coupled to an Axio Imager Z1 microscope (Carl Zeiss Inc.) using the Isis Imaging System software. Quantification of mean intensity for Nestin, GFAP and TUJ1 fluorescence is displayed (D). SPRY1 and β-Actin (loading control) protein levels were measured by Western blot in the GN1C and G63 cell lines at the NS state (0h) and after 96 hours (96h) of induction of their differentiation (E), as well as 96 hours after transfection with pre-miR-21 (21) or a pre-miR negative control (C-) (F). A time-course study of SPRY protein expression by Western blot was also performed at 48, 72 and 96 hours after transfection with pre-miR-21 (21) or a pre-miR negative control (C-) (G). Quantification of at least three independent replicates was performed using ImageJ software and is shown as SPRY1/β-Actin expression relative to pre-miR negative control transfected cells (100%). Specific binding of miR-21 to the 3´-UTR binding sites of SPRY1 was assessed in the GN1C cell line using luciferase assays and site-directed mutagenesis (H) “Mut 1” corresponds to mutation of the site in position chr4:124324121-124324128 and “Mut 2” to chr4:124323893-124323900. Transfections were carried out in triplicate. * indicates p value <0.05 in unpaired t test statistical analysis using the Holm-Bonferroni correction for multiple comparisons.
Figure 6
Figure 6. Over-expression of miR-29a/29b targets MCL1 and promotes apoptosis in GICs.
miR-29a/b over-expression in GN1C cells transfected with pre-miR-29a (pre-29a) or pre-miR-29b (pre-29b) compared to pre-miR negative control (pre-C-) was confirmed by q-RT-PCR 4 days after transfection (A, B). Cell viability assays using MTS (C) and apoptosis assessment by Cell Death Detection kit (D) were carried out 4 days after transfection. MCL1 protein levels were also measured by Western blot at the same time point, using β-Actin as loading control (E). Quantification of Western blots was performed with ImageJ (F) and is displayed as the MCL1/β-actin ratio relative to the negative control (100%). Regulation of the 3´-UTR of MCL1 by miR-29a and miR-29b was analyzed by luciferase assays (G). All experiments were carried out at least in triplicate. * indicates p value <0.05 in unpaired t test or Mann-Whitney U test, using the Holm-Bonferroni correction for multiple comparisons.

References

    1. Miller CR, Perry A (2007) Glioblastoma. Arch Pathol Lab Med 131: 397-406. PubMed: 17516742. - PubMed
    1. Stupp R, Mason WP, van den Bent MJ, Weller M, Fisher B et al. (2005) Radiotherapy plus concomitant and adjuvant temozolomide for glioblastoma. N Engl J Med 352: 987-996. doi: 10.1056/NEJMoa043330. PubMed: 15758009. - DOI - PubMed
    1. Vescovi AL, Galli R, Reynolds BA (2006) Brain tumour stem cells. Nat Rev_Cancer 6: 425-436. PubMed: 16723989. - PubMed
    1. Galli R, Binda E, Orfanelli U, Cipelletti B, Gritti A et al. (2004) Isolation and characterization of tumorigenic, stem-like neural precursors from human glioblastoma. Cancer Res 64: 7011-7021. doi: 10.1158/0008-5472.CAN-04-1364. PubMed: 15466194. - DOI - PubMed
    1. Singh SK, Hawkins C, Clarke ID, Squire JA, Bayani J et al. (2004) Identification of human brain tumour initiating cells. Nature 432: 396-401. doi: 10.1038/nature03128. PubMed: 15549107. - DOI - PubMed

Publication types

MeSH terms