

Evaluation of a screening system for obesogenic compounds: screening of endocrine disrupting compounds and evaluation of the PPAR dependency of the effect
- PMID: 24155963
- PMCID: PMC3796469
- DOI: 10.1371/journal.pone.0077481
Evaluation of a screening system for obesogenic compounds: screening of endocrine disrupting compounds and evaluation of the PPAR dependency of the effect
Abstract
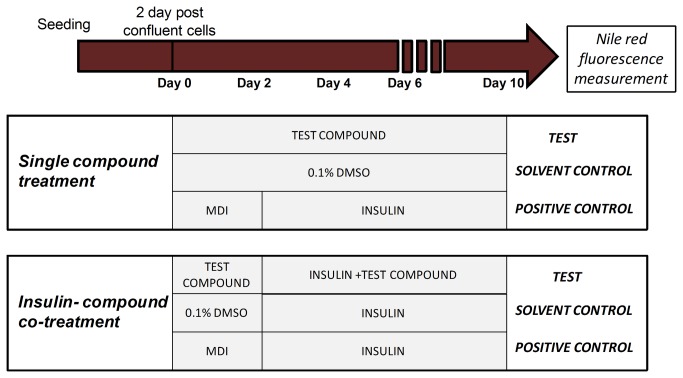
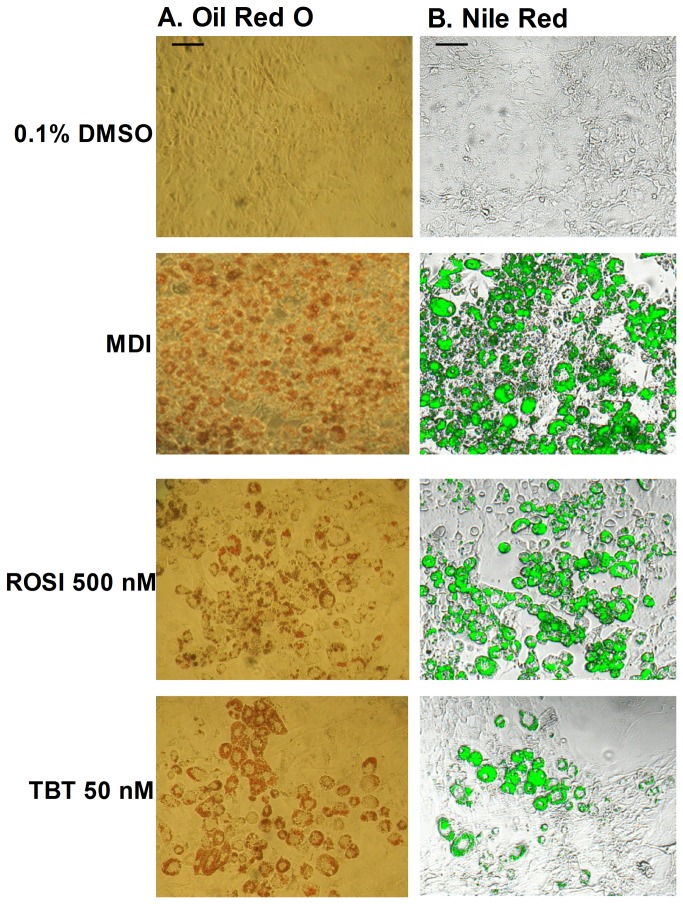
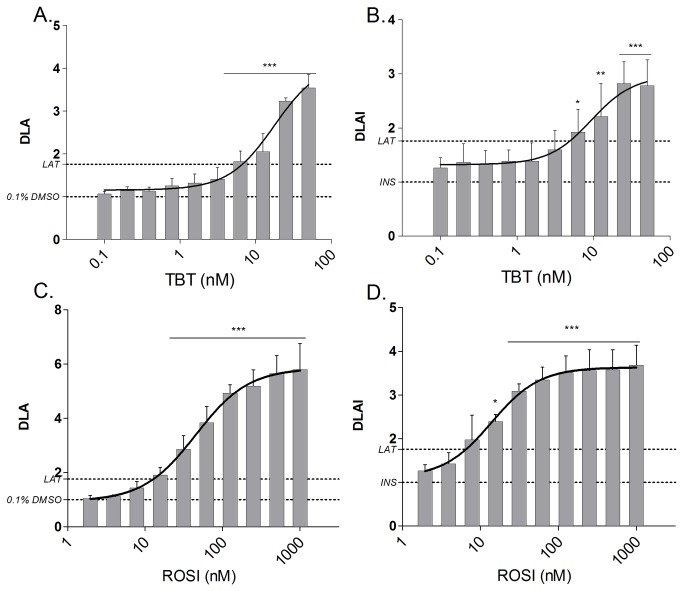
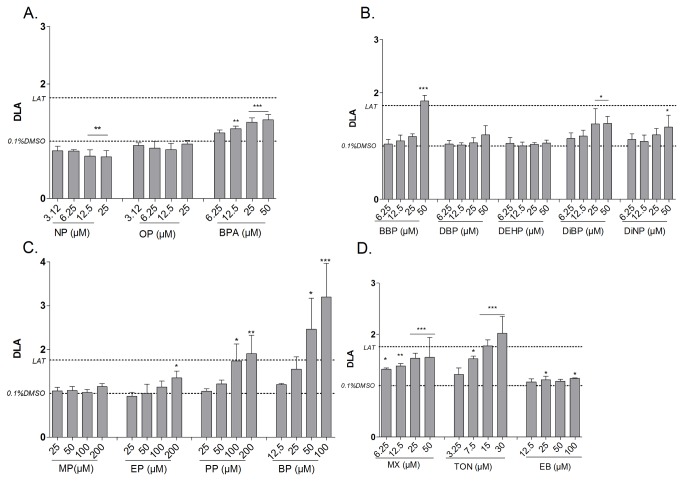
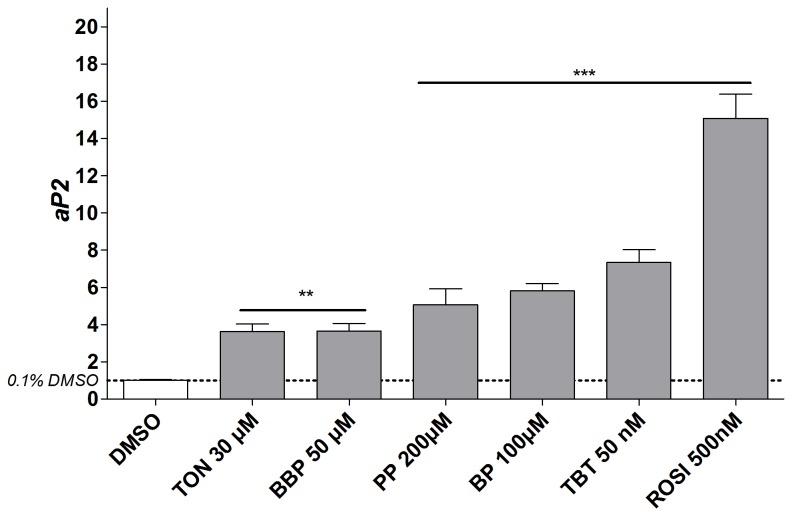
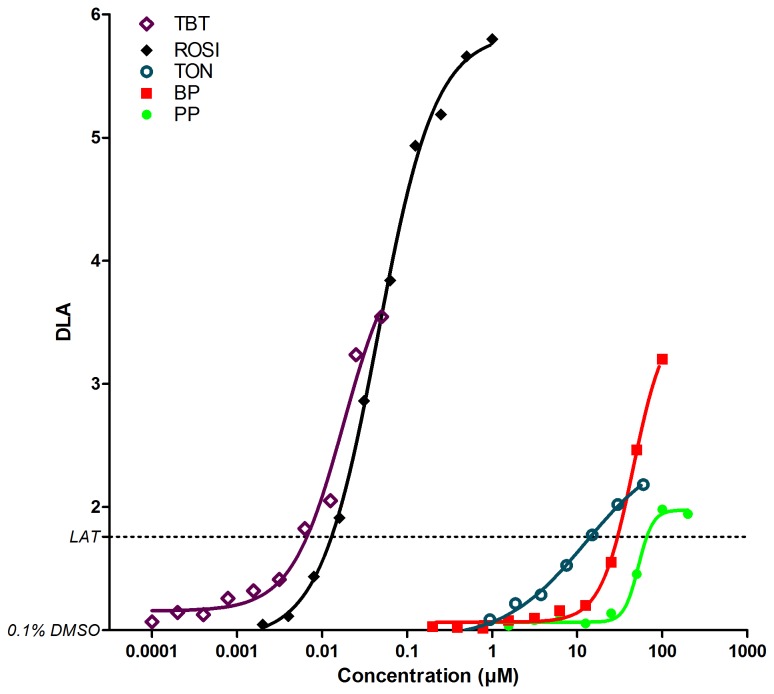
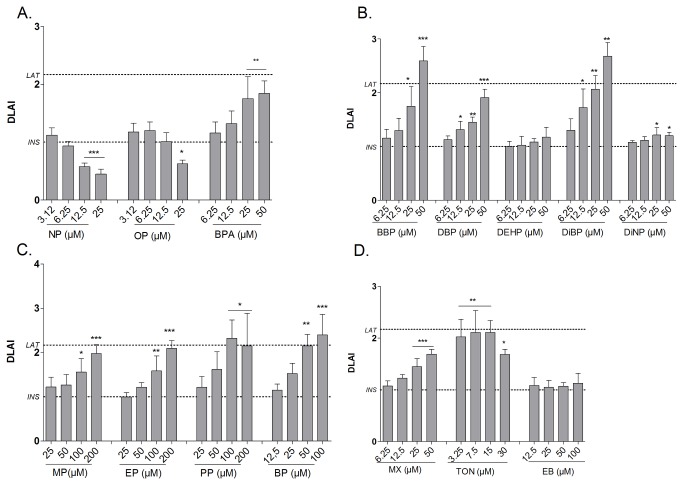
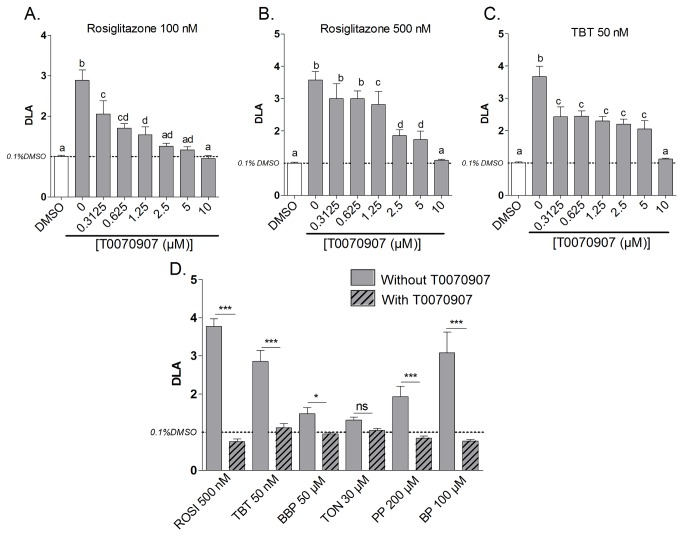
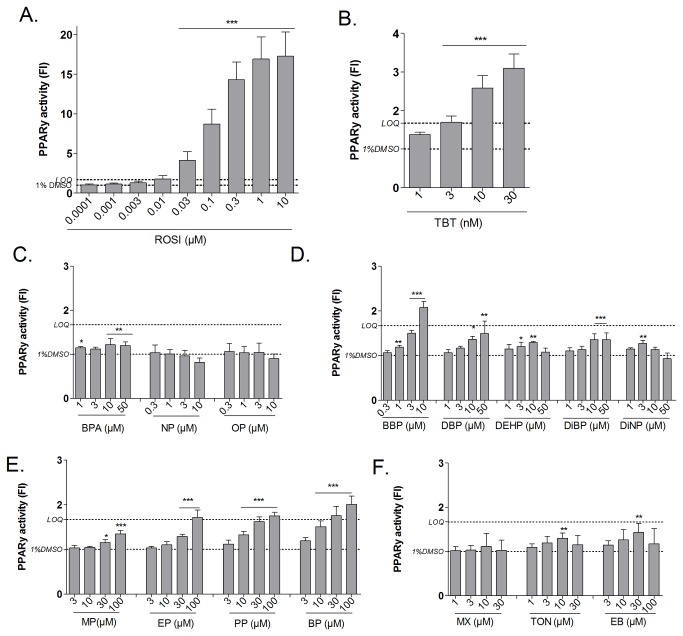
Recently the environmental obesogen hypothesis has been formulated, proposing a role for endocrine disrupting compounds (EDCs) in the development of obesity. To evaluate this hypothesis, a screening system for obesogenic compounds is urgently needed. In this study, we suggest a standardised protocol for obesogen screening based on the 3T3-L1 cell line, a well-characterised adipogenesis model, and direct fluorescent measurement using Nile red lipid staining technique. In a first phase, we characterised the assay using the acknowledged obesogens rosiglitazone and tributyltin. Based on the obtained dose-response curves for these model compounds, a lipid accumulation threshold value was calculated to ensure the biological relevance and reliability of statistically significant effects. This threshold based method was combined with the well described strictly standardized mean difference (SSMD) method for classification of non-, weak- or strong obesogenic compounds. In the next step, a range of EDCs, used in personal and household care products (parabens, musks, phthalates and alkylphenol compounds), were tested to further evaluate the obesogenicity screening assay for its discriminative power and sensitivity. Additionally, the peroxisome proliferator activated receptor γ (PPARγ) dependency of the positive compounds was evaluated using PPARγ activation and antagonist experiments. Our results showed the adipogenic potential of all tested parabens, several musks and phthalate compounds and bisphenol A (BPA). PPARγ activation was associated with adipogenesis for parabens, phthalates and BPA, however not required for obesogenic effects induced by Tonalide, indicating the role of other obesogenic mechanisms for this compound.
Conflict of interest statement
Figures
Similar articles
-
Environmental obesogens (bisphenols, phthalates and parabens) and their impacts on adipogenic transcription factors in the absence of dexamethasone in 3T3-L1 cells.J Steroid Biochem Mol Biol. 2021 Nov;214:105994. doi: 10.1016/j.jsbmb.2021.105994. Epub 2021 Sep 1. J Steroid Biochem Mol Biol. 2021. PMID: 34481040
-
Tetra methyl bisphenol F: another potential obesogen.Int J Obes (Lond). 2024 Jul;48(7):923-933. doi: 10.1038/s41366-024-01496-5. Epub 2024 Feb 22. Int J Obes (Lond). 2024. PMID: 38388800 Free PMC article.
-
Low-dose Bisphenol-A Promotes Epigenetic Changes at Pparγ Promoter in Adipose Precursor Cells.Nutrients. 2020 Nov 13;12(11):3498. doi: 10.3390/nu12113498. Nutrients. 2020. PMID: 33203037 Free PMC article.
-
Bisphenol A substitutes and obesity: a review of the epidemiology and pathophysiology.Front Endocrinol (Lausanne). 2023 Jul 17;14:1155694. doi: 10.3389/fendo.2023.1155694. eCollection 2023. Front Endocrinol (Lausanne). 2023. PMID: 37529602 Free PMC article. Review.
-
Minireview: PPARγ as the target of obesogens.J Steroid Biochem Mol Biol. 2011 Oct;127(1-2):4-8. doi: 10.1016/j.jsbmb.2011.01.005. Epub 2011 Jan 18. J Steroid Biochem Mol Biol. 2011. PMID: 21251979 Free PMC article. Review.
Cited by
-
Mixtures of Urinary Phenol and Phthalate Metabolite Concentrations in Relation to Serum Lipid Levels among Pregnant Women: Results from the EARTH Study.Toxics. 2024 Aug 7;12(8):574. doi: 10.3390/toxics12080574. Toxics. 2024. PMID: 39195676 Free PMC article.
-
Epigenetic Mechanisms of Endocrine-Disrupting Chemicals in Obesity.Biomedicines. 2021 Nov 18;9(11):1716. doi: 10.3390/biomedicines9111716. Biomedicines. 2021. PMID: 34829943 Free PMC article. Review.
-
Altered lipid homeostasis in a PCB-resistant Atlantic killifish (Fundulus heteroclitus) population from New Bedford Harbor, MA, U.S.A.Aquat Toxicol. 2019 May;210:30-43. doi: 10.1016/j.aquatox.2019.02.011. Epub 2019 Feb 18. Aquat Toxicol. 2019. PMID: 30822701 Free PMC article.
-
Environmentally relevant exposure to dibutyl phthalate disrupts DNA damage repair gene expression in the mouse ovary†.Biol Reprod. 2019 Oct 25;101(4):854-867. doi: 10.1093/biolre/ioz122. Biol Reprod. 2019. PMID: 31318015 Free PMC article.
-
Parabens inhibit fatty acid amide hydrolase: A potential role in paraben-enhanced 3T3-L1 adipocyte differentiation.Toxicol Lett. 2016 Nov 16;262:92-99. doi: 10.1016/j.toxlet.2016.09.011. Epub 2016 Sep 19. Toxicol Lett. 2016. PMID: 27659731 Free PMC article.
References
Publication types
MeSH terms
Substances
LinkOut - more resources
Full Text Sources
Other Literature Sources
Medical
