. 2013 Oct 14;8(10):e77728.
doi: 10.1371/journal.pone.0077728. eCollection 2013.

A neuron-based screening platform for optimizing genetically-encoded calcium indicators

Affiliations

A neuron-based screening platform for optimizing genetically-encoded calcium indicators

Trevor J Wardill et al. PLoS One. .

Abstract

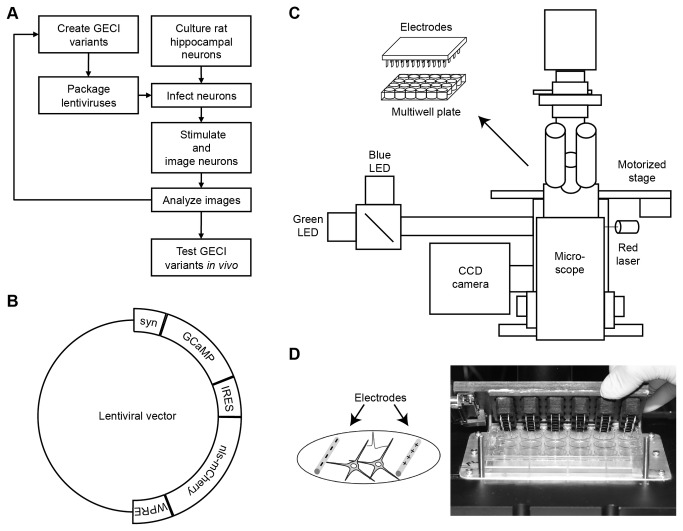
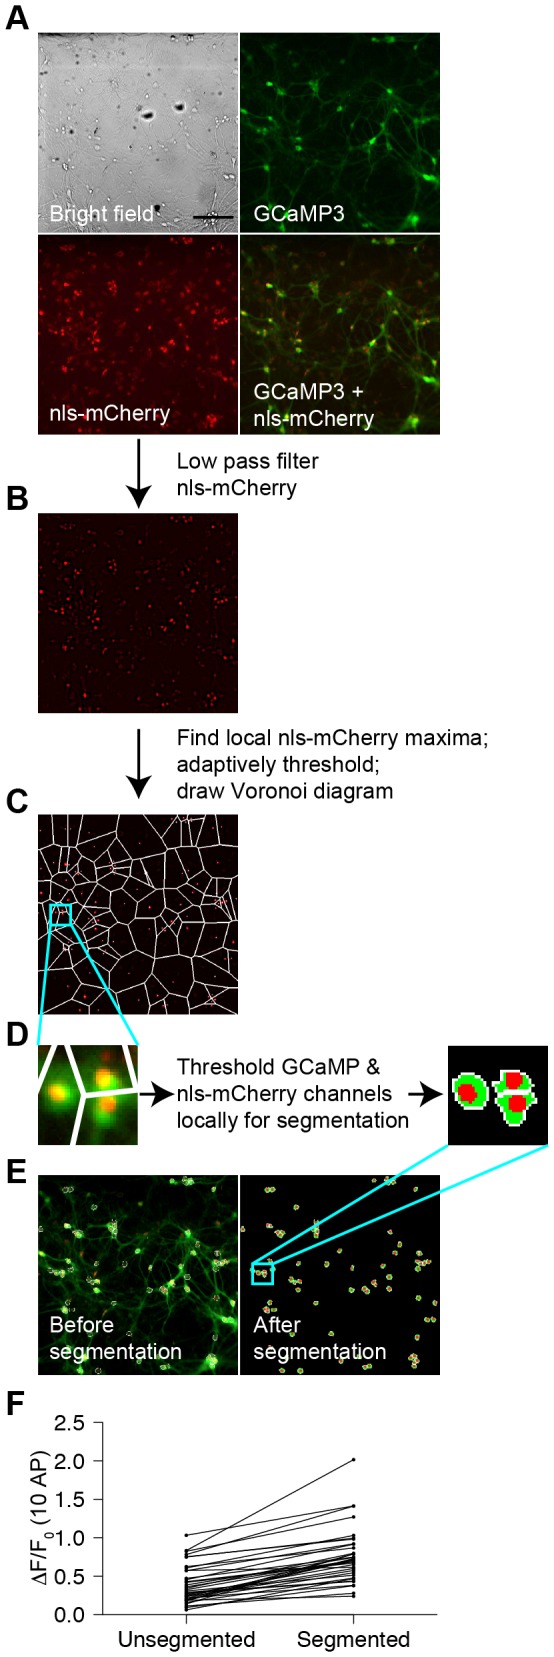
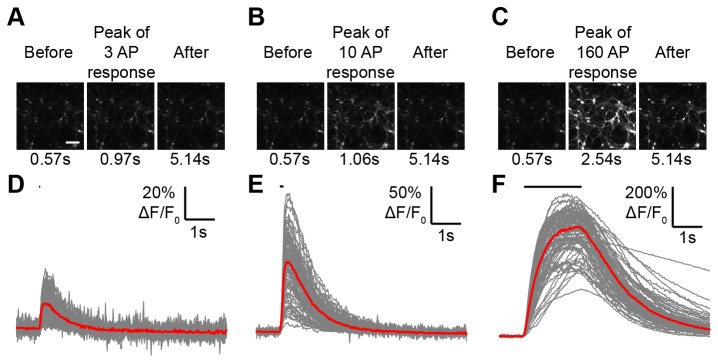
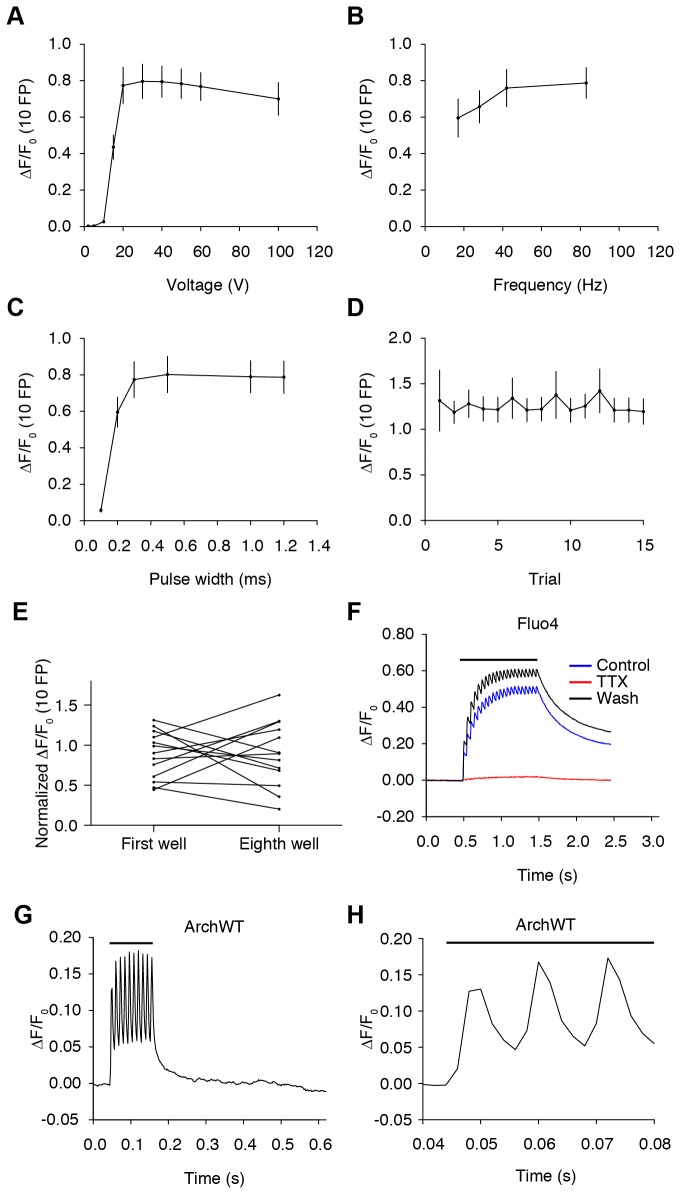
Fluorescent protein-based sensors for detecting neuronal activity have been developed largely based on non-neuronal screening systems. However, the dynamics of neuronal state variables (e.g., voltage, calcium, etc.) are typically very rapid compared to those of non-excitable cells. We developed an electrical stimulation and fluorescence imaging platform based on dissociated rat primary neuronal cultures. We describe its use in testing genetically-encoded calcium indicators (GECIs). Efficient neuronal GECI expression was achieved using lentiviruses containing a neuronal-selective gene promoter. Action potentials (APs) and thus neuronal calcium levels were quantitatively controlled by electrical field stimulation, and fluorescence images were recorded. Images were segmented to extract fluorescence signals corresponding to individual GECI-expressing neurons, which improved sensitivity over full-field measurements. We demonstrate the superiority of screening GECIs in neurons compared with solution measurements. Neuronal screening was useful for efficient identification of variants with both improved response kinetics and high signal amplitudes. This platform can be used to screen many types of sensors with cellular resolution under realistic conditions where neuronal state variables are in relevant ranges with respect to timing and amplitude.


Conflict of interest statement

Competing Interests: The authors have the following competing interests. A patent application has been filed on the neuronal culture screening methods ("Genetically Encoded Calcium Indicators and Methods of Use" USPTO 61/711,995). There are no further patents, products in development or marketed products to declare. This does not alter the authors' adherence to all the PLOS ONE policies on sharing data and materials, as detailed online in the guide for authors.

Figures

Figure 1
Figure 1. Primary neuron stimulus and imaging screening platform.
(A) Flow chart for GECI optimization on screening platform. (B) Prolentiviral vector with human synapsin-1 promoter (syn), GCaMP variant, internal ribosome entry site (IRES), nuclear localization signal fused with mCherry (nls-mCherry), and woodchuck hepatitis virus post-transcriptional regulatory element (WPRE). (C) Schematic of screening platform. (D) Schematic of electrodes evoking APs from cultured neurons. Photo of 24-well cap stimulator with pairs of parallel platinum wires.
Figure 2
Figure 2. Segmentation of neuronal cell bodies for image analysis.
(A) Bright field and epifluorescence images showing GCaMP3 fluorescence channel, nls-mCherry fluorescence channel, and red and green merged fluorescence channels. Scale bar: 150 µm. (B) nls-mCherry fluorescence channel after low-pass frequency filtering with a circular kernel to identify putative nuclei. (C) Partially segmented image where local intensity maxima were identified using adaptively defined thresholds followed by cutting of image into a Voronoi diagram based on seeds identified by maxima. (D) Images from inset in (C) before and after adaptive thresholding in the GCaMP and mCherry channels within each sub-region to define pixels that belong to cytosol and nuclei. (E) Images before and after final segmentation, where regions of interest were excluded if the average mCherry level did not reach a predefined threshold or if the regions of interest touched the image boundary. (F) GCaMP3 10 AP ∆F/F0 response before and after segmentation (36 wells).
Figure 3
Figure 3. GCaMP3 fluorescence responses in neuronal culture.
(A) 3 AP fluorescence response for GCaMP3. Scale bar: 150 µm. (B) 10 AP. (C) 160 AP. (D) 3 AP ∆F/F0 traces for 78 regions of interest (gray). Median trace (red). Stimulus duration (black line). (E) 10 AP. (F) 160 AP.
Figure 4
Figure 4. Optimization of platform stimulation parameters.
(A) Voltage dependency of GCaMP3 ∆F/F0 (10 FP) response at 2, 5, 10, 15, 20, 30, 40, 50, 60, 100 V at 83 Hz and 1 ms pulse width (median ± s.e.m.; 8 wells). (B) Frequency dependency at 17, 28, 42, 83 Hz at 40 V and 1 ms pulse width (8 wells). (C) Stimulus pulse width dependency at 0.1, 0.2, 0.3, 0.5, 1, 1.2 ms at 40 V and 83 Hz (8 wells). (D) Response to 15 separate trials with ~1-min intratrial intervals (40 V, 83 Hz, 1 ms pulse width; 26 wells). (E) ∆F/F0 (10 AP) responses of first and eighth wells on individual plates normalized to the averaged response of all eight wells. Stimulation of the first and last wells was separated by ~90 min (first and eighth wells from 13 plates). (F) Fluo4 averaged ∆F/F0 (21 AP) trace (6 regions of interest) in imaging buffer (blue), after addition of 1 µM tetrodotoxin (TTX, red), and after washout (black). High-speed imaging was employed (227 Hz). Stimulus duration (black line). (G) Voltage imaging trace of neurons in a single well showing the ∆F/F0 (10 FP) response of the ArchWT-GFP voltage sensor at 40 V, 83 Hz, and 1 ms pulse width. Pixels were segmented for analysis based on activity [33]. (H) Voltage imaging from (G) on expanded timescale.
Figure 5
Figure 5. Optimization of platform pharmacological parameters.
(A) ∆F/F0 (10 AP) response over time with imaging buffer alone (vehicle, black; 5 wells); ionotropic glutamate receptor blockers (CNQX+CPP, red; 30 wells); ionotropic glutamate and GABA receptor blockers (CNQX+CPP+GABAZINE, green; 28 wells); ionotropic glutamate, GABA, and metabotropic glutamate receptor blockers (CNQX+CPP+GABAZINE+MCPG, blue; 28 wells); (median ± s.e.m.). (Inset) The coefficient of variation of peak responses. (B) ∆F/F0 responses from 1-160 AP (median ± s.e.m.).
Figure 6
Figure 6. Neuronal culture platform performance parameters and detection sensitivity.
(A) GCaMP3 basal fluorescence (F0) relationship with mCherry fluorescence (249 wells). (B) ∆F/F0 (10 AP) response relationship with mCherry fluorescence. (C) mCherry fluorescence relationship with number of infected cells. (D) Median ∆F/F0 (10 AP) response dependency on number of infected cells. (E) Percent detectable improvement relative to GCaMP3 performance was estimated by simulating 105 experiments using 3 to 12 replicate wells drawn from a data set of 249 GCaMP3 wells. The difference between the mean and the 99th percentile of simulated result distributions normalized by the mean defined the detection sensitivity at α=0.01 (red: 1 AP, green: 3 AP, blue: 10 AP, magenta: 160 AP, black: decay time (10 AP)). (F) After compensation correcting for infected cell density effect.
Figure 7
Figure 7. Calcium indicator performance in vitro and in vivo.
(A) Median ∆F/F0 responses of GCaMP3 (gray, 6 wells), GCaMP5K (magenta, 6 wells), GCaMP5G (cyan, 6 wells), and Fluo4 (orange, 8 wells) after 1, 2, 3, 5, 10, 20, 40, 80, 160 AP (median ± s.e.m.; *p<0.05, **p<0.01, ***p<0.001, ****p<0.0001, compared to GCaMP3 by Tukey HSD test). (B) Averaged ∆F/F0 (1 AP) trace for GCaMP3 (6 wells), GCaMP5G (6 wells), and Fluo4 (8 wells). Stimulus duration (black line); (median ± s.e.m.). (C) ∆F/F0 (1 AP) response of GCaMP3 (9 cells), GCaMP5K (9 cells), 6f (11 cells), 6m (10 cells), and 6s (9 cells) in mouse somatosensory (GCaMP3) or visual cortical neurons (GCaMP5K, 6f, 6m, 6s; data from [5,20,34]) versus neuronal culture (GCaMP3, 249 wells; 5K, 6 wells; 6f, 16 wells; 6m, 16 wells; 6s, 17 wells); (median ± s.e.m.). (D) Decay times (τ1/2) for GCaMP5K, 6f, 6m, and 6s. GCaMP3 cortical decay time was not reported in [5].
Figure 8
Figure 8. Neuronal culture platform and purified protein measurements for GCaMP variants.
Purified protein measurements do not predict GCaMP variant performance in neurons. Each variant is represented as a circle. The calcium affinity and fluorescence response from purified protein measurements are plotted on the x-axis and y-axis, respectively. Variant performance in neurons (fluorescence change or decay kinetics) is shown by the area of each circle. (A) Neuronal ∆F/F0 (10 AP; 4 to 249 wells) of variants (circle area) compared with protein ∆Fsat/Fapo and apparent calcium affinity (Kd). (B) Neuronal decay time (τ1/2, 10 AP) of variants (circle area) compared with protein ∆Fsat/Fapo and apparent calcium affinity (Kd). GCaMP3 (gray circle), GCaMP5G (cyan circle).

References

    1. Looger LL, Griesbeck O (2012) Genetically encoded neural activity indicators. Curr Opin Neurobiol 22: 18-23. doi:10.1016/j.conb.2011.10.024. PubMed: 22104761. - DOI - PubMed
    1. Horikawa K, Yamada Y, Matsuda T, Kobayashi K, Hashimoto M et al. (2010) Spontaneous network activity visualized by ultrasensitive Ca(2+) indicators, yellow Cameleon-Nano. Nat Methods 7: 729-732. doi:10.1038/nmeth.1488. PubMed: 20693999. - DOI - PubMed
    1. Huber D, Gutnisky DA, Peron S, O'Connor DH, Wiegert JS et al. (2012) Multiple dynamic representations in the motor cortex during sensorimotor learning. Nature 484: 473-478. doi:10.1038/nature11039. PubMed: 22538608. - DOI - PMC - PubMed
    1. Mank M, Santos AF, Direnberger S, Mrsic-Flogel TD, Hofer SB et al. (2008) A genetically encoded calcium indicator for chronic in vivo two-photon imaging. Nat Methods 5: 805-811. doi:10.1038/nmeth.1243. PubMed: 19160515. - DOI - PubMed
    1. Tian L, Hires SA, Mao T, Huber D, Chiappe ME et al. (2009) Imaging neural activity in worms, flies and mice with improved GCaMP calcium indicators. Nat Methods 6: 875-881. doi:10.1038/nmeth.1398. PubMed: 19898485. - DOI - PMC - PubMed

Publication types