. 2013 Oct 14;8(10):e78087.
doi: 10.1371/journal.pone.0078087. eCollection 2013.

Ankyrin-G participates in INa remodeling in myocytes from the border zones of infarcted canine heart

Affiliations

Ankyrin-G participates in INa remodeling in myocytes from the border zones of infarcted canine heart

Wen Dun et al. PLoS One. .

Abstract

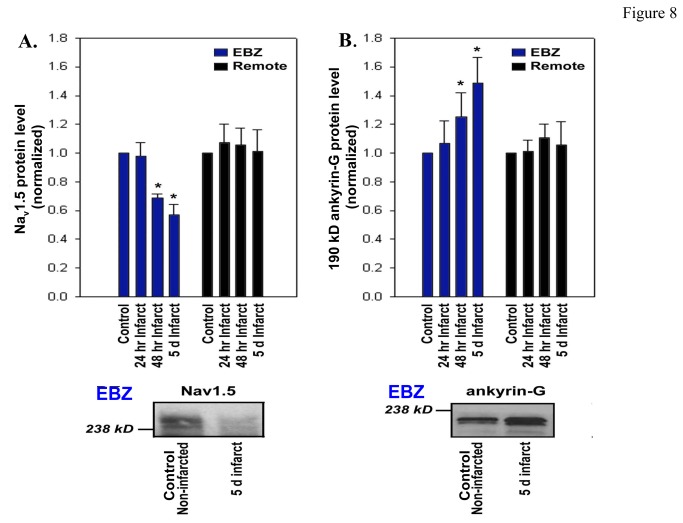
Cardiac Na channel remodeling provides a critical substrate for generation of reentrant arrhythmias in border zones of the infarcted canine heart. Recent studies show that Nav1.5 assembly and function are linked to ankyrin-G, gap, and mechanical junction proteins. In this study our objective is to expound the status of the cardiac Na channel, its interacting protein ankyrinG and the mechanical and gap junction proteins at two different times post infarction when arrhythmias are known to occur; that is, 48 hr and 5 day post coronary occlusion. Previous studies have shown the origins of arrhythmic events come from the subendocardial Purkinje and epicardial border zone. Our Purkinje cell (Pcell) voltage clamp study shows that INa and its kinetic parameters do not differ between Pcells from the subendocardium of the 48hr infarcted heart (IZPCs) and control non-infarcted Pcells (NZPCs). Immunostaining studies revealed that disturbances of Nav1.5 protein location with ankyrin-G are modest in 48 hr IZPCs. Therefore, Na current remodeling does not contribute to the abnormal conduction in the subendocardial border zone 48 hr post myocardial infarction as previously defined. In addition, immunohistochemical data show that Cx40/Cx43 co-localize at the intercalated disc (IDs) of control NZPCs but separate in IZPCs. At the same time, Purkinje cell desmoplakin and desmoglein2 immunostaining become diffuse while plakophilin2 and plakoglobin increase in abundance at IDs. In the epicardial border zone 5 days post myocardial infarction, immunoblot and immunocytochemical analyses showed that ankyrin-G protein expression is increased and re-localized to submembrane cell regions at a time when Nav1.5 function is decreased. Thus, Nav1.5 and ankyrin-G remodeling occur later after myocardial infarction compared to that of gap and mechanical junctional proteins. Gap and mechanical junctional proteins remodel in IZPCs early, perhaps to help maintain Nav1.5 subcellular location position and preserve its function soon after myocardial infarction.


Conflict of interest statement

Competing Interests: The authors have declared that no competing interests exist.

Figures

Figure 1
Figure 1. Sodium currents do not differ between NZPCs and IZPCS.
Family of tracings of I Na in NZPC (Panel A, Left) and IZPC (Panel A, Right). I Nas were elicited from a V H of -100 mV to various levels of Vt (-65 to +10 mV). The calibration bar is inserted. Panel B: I Na density-voltage relationships in NZPCs (n=19) and IZPCs (n=11). There is no significant difference in the peak currents at voltage -25 mV between NZPCs and IZPCs (P>0.05). Panel C: Steady-state activation of I Na in NZPCs and IZPCs. Curves drawn represent Boltzmann equation using average of fit values (see Table 1). All data were collected at 23-25 min after whole-cell membrane rupture.
Figure 2
Figure 2. Sodium current inactivation does differ between the two groups.
Steady state inactivation of I Na in NZPCs and IZPCs. Panel A, the original tracings of I Na obtained during the “steady state” inactivation protocol in NZPC (top) and IZPC (bottom) after subtraction of membrane capacity and linear leakage. Arrow indicates I Na after conditioning potential (Vc) to -90 mV. Panel B shows average I/Imax curves constructed using data recorded with the same protocol in both cell types. The current amplitude elicited by the test pulse at each prepulse voltage was normalized to the maximal current obtained after prepulse voltage to -140 mV. The I/Imax curves were created by plotting the normalized current against Vc. V0.5 was -84.4±1.7 mV in NZPCs (n=16) and -83.8±1.3 in IZPCs (n=10) (P>0.05).
Figure 3
Figure 3. Rate of development of inactivation of I Na from depolarized conditioning potential (-60 mV) does differ between the two groups .
Panel A shows I Na tracings from NZPC (top) and IZPC (bottom) obtained during protocol. The test I Na (VH=-100 to -25 mV) obtained after prepulses to -60 mV of variable duration are superimposed. Note that there were no significant differences between NZPC and IZPC. Panel B, I Na amplitude of the test pulse is normalized to maximal I Na (I max, obtained with 0-ms conditioning pulse). The time course of I Na inactivation was best described by a bi-exponential function (see inset).
Figure 4
Figure 4. Co-staining of Nav1.5 and ankyrin-G in non-infarcted and infarcted Purkinje cells.
Panel A. Distribution of ankyrin-G and Nav1.5 protein in NZPFs (upper) and IZPFs (lower). Fixed Purkinje fibers were cryostat-sectioned (5 µm) longitudinally and labeled with anti-ankyrin-G and Nav1.5 antibodies. Note that Nav1.5 is on cell surface and IDs in both NZPFs and IZPFs. Very few side-to-side junctions are observed in Purkinjes (Arrowheads) Panel B, Co-staining of Nav1.5 with ankyrin-G (AnkG) in NZPC (upper) and IZPCs (lower). Co-localization of ankyrin-G and Nav1.5 is similar in NZPCs and IZPCs.
Figure 5
Figure 5. Co-staining of Cx40 (Green) and Cx43 (Red) in NZPFS (upper) and IZPFs (lower).
The enlarged images from the white rectangles of NZPFs and IZPFs are shown to the right, respectively. In NZPFs, Cx40 and Cx43 are uniformly and tightly colocalized at IDs, showing concentrated yellow merge sites. However, in IZPFs, individual bands of Cx40 and Cx43 are separated, exhibiting discrete red (Cx43), green (Cx40) bands. Yellow (merged) bands at IDs still exist.
Figure 6
Figure 6. N-Cadherin expression and localization in NZPFs and IZPFs.
N-cadherin signals in both NZPFs and IZPFs were located at the IDs.
Figure 7
Figure 7. Expression and localization of plakophilin2 (PKP2, panel A), plakoglobin (PKG, panel B), desmoplakin (DP, panel C) and desmoglein-2 (Dsg2, panel D) in NZPFs (upper) and IZPFs (lower).
The enlarged images of white rectangles in NZPFs and IZPFs are shown to the right. Immunofluorescence signals show that PKP2 (A) and PKG (B) thickens at some sites of the IDs in IZPFs, while there is a lower abundance and diffusion of DP(C) and Dsg2 (D) at the IDs in IZPFs. Panel E, Co-staining for Nav1.5 (Green) with PKP2 (Red) in NZPFs (Upper) and IZPFs (lower). PKP2 and Nav1.5 colocalized at IDs in both NZPFs and IZPFs.
Figure 8
Figure 8. Detection of Nav1.5 and ankyrin-G by immunoblot.
Relative expression of Nav1.5 (Panel A) and 190 kD ankyrin-G (Panel B) in control (non-infarcted hearts) and post infarct canine epicardial tissue.  Tissues were collected from infarcted hearts (both EBZ and Remote) at post occlusion 24 hr, 48 hr, and 5 days.  Cell lysates were prepared and equal quantities of protein were analyzed by SDS-PAGE and blotted using affinity-purified Ig prepared against 190 kD ankyrin-G, Nav1.5, or a loading control. Linear band intensities were normalized, averaged and plotted as levels relative to control samples (N=4).  Means ± SEM. An example of blots is shown below each graph, respectively.
Figure 9
Figure 9. Immunolocalization of ankyrin-G in 5 day IZ (panel A) and Remote cells (panel B).
The altered ankyrin-G staining appears to increase in signal just below membrane in IZ. Panel C: Ratio of surface/core of ankyrin-G staining measured in IZ and Remote. Open symbols: individual measurements. See text for details Filled symbols and vertical bars: means and SE. *P<0.05 vs Remote.

References

    1. Wit AL, Janse MJ (1993) The Ventricular Arrhythmias of Ischemia and Infarction. Electrophysiological Mechanisms. Mount Kisco, NY. Futura Publishing Co,Inc.
    1. Boyden PA, Jeck CD (1995) Ion channel function in disease. Cardiovasc Res 29: 312-318. doi:10.1016/S0008-6363(96)88586-5. PubMed: 7540109. - DOI - PubMed
    1. Baba S, Dun W, Cabo C, Boyden PA (2005) Remodeling in cells from different regions of the reentrant circuit during ventricular tachycardia. Circ 112: 2386-2396. doi:10.1161/CIRCULATIONAHA.105.534784. PubMed: 16203911. - DOI - PMC - PubMed
    1. Mohler PJ, Rivolta I, Napolitano C, LeMaillet G, Lambert S, Priori SG, Bennett V (2004) Nav1.5 E1053K mutation causing Brugada syndrome blocks binding to ankyrinG and expression of NAv1.5 on the surface of cardiomyocytes. Proc Natl Acad Sci USA 101: 17533-17538. doi:10.1073/pnas.0403711101. PubMed: 15579534. - DOI - PMC - PubMed
    1. Friedman PL, Stewart JR, Fenoglio JJJr, Wit AL (1973) Survival of subendocardial Purkinje fibers after extensive myocardial infarction in dogs. Circ Res 33: 597-611. doi:10.1161/01.RES.33.5.597. PubMed: 4752859. - DOI - PubMed

Publication types

MeSH terms