

Multi-MHz retinal OCT
- PMID: 24156052
- PMCID: PMC3799654
- DOI: 10.1364/BOE.4.001890
Multi-MHz retinal OCT
Abstract
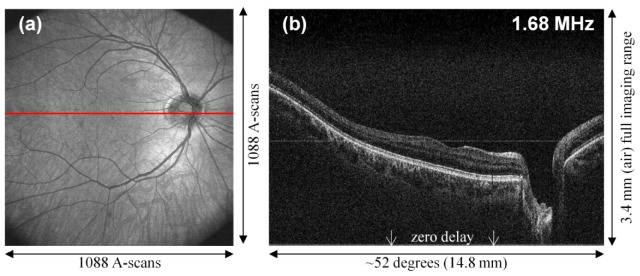
We analyze the benefits and problems of in vivo optical coherence tomography (OCT) imaging of the human retina at A-scan rates in excess of 1 MHz, using a 1050 nm Fourier-domain mode-locked (FDML) laser. Different scanning strategies enabled by MHz OCT line rates are investigated, and a simple multi-volume data processing approach is presented. In-vivo OCT of the human ocular fundus is performed at different axial scan rates of up to 6.7 MHz. High quality non-mydriatic retinal imaging over an ultra-wide field is achieved by a combination of several key improvements compared to previous setups. For the FDML laser, long coherence lengths and 72 nm wavelength tuning range are achieved using a chirped fiber Bragg grating in a laser cavity at 419.1 kHz fundamental tuning rate. Very large data sets can be acquired with sustained data transfer from the data acquisition card to host computer memory, enabling high-quality averaging of many frames and of multiple aligned data sets. Three imaging modes are investigated: Alignment and averaging of 24 data sets at 1.68 MHz axial line rate, ultra-dense transverse sampling at 3.35 MHz line rate, and dual-beam imaging with two laser spots on the retina at an effective line rate of 6.7 MHz.
Keywords: (120.3890) Medical optics instrumentation; (140.3510) Lasers, fiber; (170.3880) Medical and biological imaging; (170.4460) Ophthalmic optics and devices; (170.4500) Optical coherence tomography.
Figures


Similar articles
-
High-resolution retinal swept source optical coherence tomography with an ultra-wideband Fourier-domain mode-locked laser at MHz A-scan rates.Biomed Opt Express. 2017 Dec 5;9(1):120-130. doi: 10.1364/BOE.9.000120. eCollection 2018 Jan 1. Biomed Opt Express. 2017. PMID: 29359091 Free PMC article.
-
Megahertz OCT for ultrawide-field retinal imaging with a 1050 nm Fourier domain mode-locked laser.Opt Express. 2011 Feb 14;19(4):3044-62. doi: 10.1364/OE.19.003044. Opt Express. 2011. PMID: 21369128
-
Megahertz ultra-wide-field swept-source retina optical coherence tomography compared to current existing imaging devices.Graefes Arch Clin Exp Ophthalmol. 2014 Jun;252(6):1009-16. doi: 10.1007/s00417-014-2640-4. Epub 2014 May 1. Graefes Arch Clin Exp Ophthalmol. 2014. PMID: 24789467
-
Fourier Domain Mode Locked Laser and Its Applications.Sensors (Basel). 2022 Apr 20;22(9):3145. doi: 10.3390/s22093145. Sensors (Basel). 2022. PMID: 35590839 Free PMC article. Review.
-
State-of-the-art retinal optical coherence tomography.Prog Retin Eye Res. 2008 Jan;27(1):45-88. doi: 10.1016/j.preteyeres.2007.07.005. Epub 2007 Aug 11. Prog Retin Eye Res. 2008. PMID: 18036865 Review.
Cited by
-
Impact of motion-associated noise on intrinsic optical signal imaging in humans with optical coherence tomography.Biomed Opt Express. 2015 Apr 9;6(5):1632-47. doi: 10.1364/BOE.6.001632. eCollection 2015 May 1. Biomed Opt Express. 2015. PMID: 26137369 Free PMC article.
-
Phase-stable swept source OCT angiography in human skin using an akinetic source.Biomed Opt Express. 2016 Jul 12;7(8):3032-48. doi: 10.1364/BOE.7.003032. eCollection 2016 Aug 1. Biomed Opt Express. 2016. PMID: 27570695 Free PMC article.
-
Line-field parallel swept source MHz OCT for structural and functional retinal imaging.Biomed Opt Express. 2015 Feb 4;6(3):716-35. doi: 10.1364/BOE.6.000716. eCollection 2015 Mar 1. Biomed Opt Express. 2015. PMID: 25798298 Free PMC article.
-
Optical phase modulation by natural eye movements: application to time-domain FF-OCT image retrieval.Biomed Opt Express. 2022 Jan 21;13(2):902-920. doi: 10.1364/BOE.445393. eCollection 2022 Feb 1. Biomed Opt Express. 2022. PMID: 35284184 Free PMC article.
-
Optical coherence tomography image denoising using a generative adversarial network with speckle modulation.J Biophotonics. 2020 Apr;13(4):e201960135. doi: 10.1002/jbio.201960135. Epub 2020 Feb 3. J Biophotonics. 2020. PMID: 31970879 Free PMC article.
References
LinkOut - more resources
Full Text Sources
Other Literature Sources