Comparative Study
. 2014 Jan;121(1):180-187.
doi: 10.1016/j.ophtha.2013.09.002. Epub 2013 Oct 21.

Phase-variance optical coherence tomography: a technique for noninvasive angiography

Affiliations
Comparative Study

Phase-variance optical coherence tomography: a technique for noninvasive angiography

Daniel M Schwartz et al. Ophthalmology. 2014 Jan.

Abstract

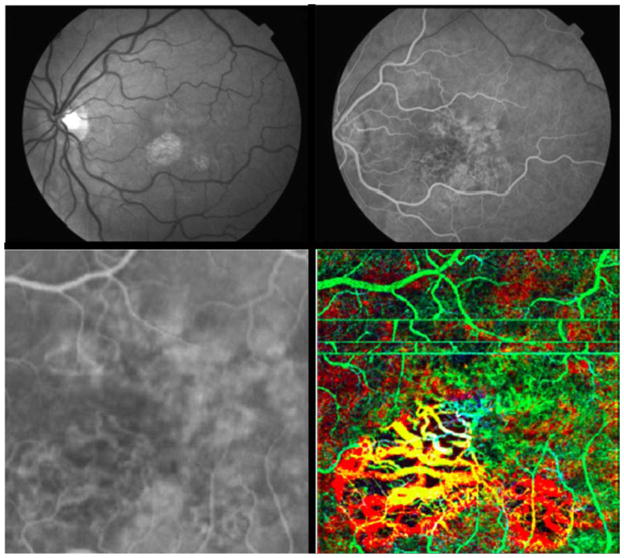
Purpose: Phase-variance optical coherence tomography (PV-OCT) provides volumetric imaging of the retinal vasculature without the need for intravenous injection of a fluorophore. We compare images from PV-OCT and fluorescein angiography (FA) for normal individuals and patients with age-related macular degeneration (AMD) and diabetic retinopathy.

Design: This is an evaluation of a diagnostic technology.

Participants: Four patients underwent comparative retinovascular imaging using FA and PV-OCT. Imaging was performed on 1 normal individual, 1 patient with dry AMD, 1 patient with exudative AMD, and 1 patient with nonproliferative diabetic retinopathy.

Methods: Fluorescein angiography imaging was performed using a Topcon Corp (Tokyo, Japan) (TRC-50IX) camera with a resolution of 1280 (H) × 1024 (V) pixels. The PV-OCT images were generated by software data processing of the entire cross-sectional image from consecutively acquired B-scans. Bulk axial motion was calculated and corrected for each transverse location, reducing the phase noise introduced from eye motion. Phase variance was calculated through the variance of the motion-corrected phase changes acquired within multiple B-scans at the same position. Repeating these calculations over the entire volumetric scan produced a 3-dimensional PV-OCT representation of the vasculature.

Main outcome measures: Feasibility of rendering retinal and choroidal microvasculature using PV-OCT was compared qualitatively with FA, the current gold standard for retinovascular imaging.

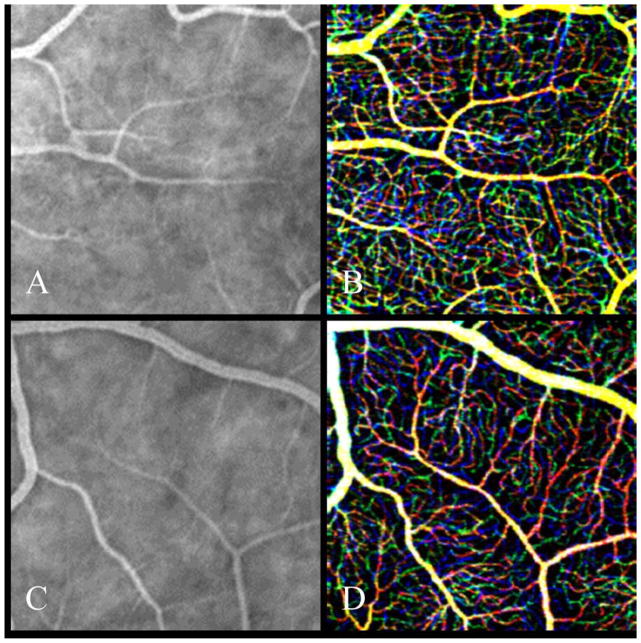
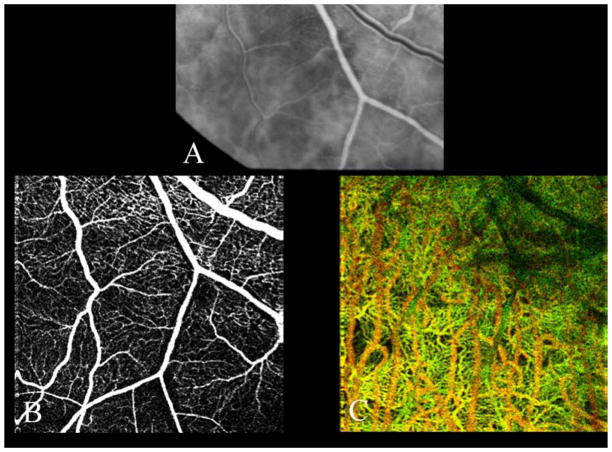
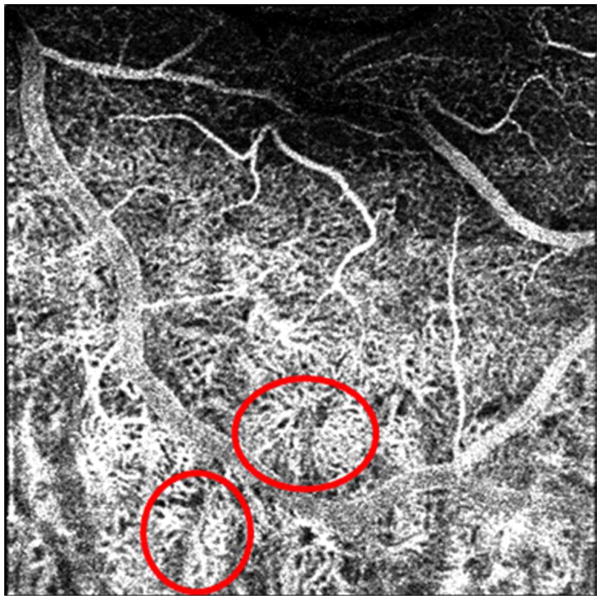
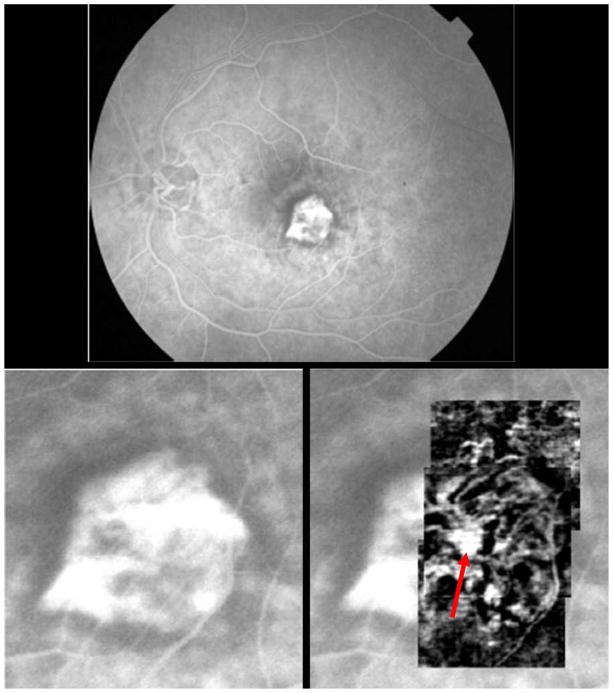
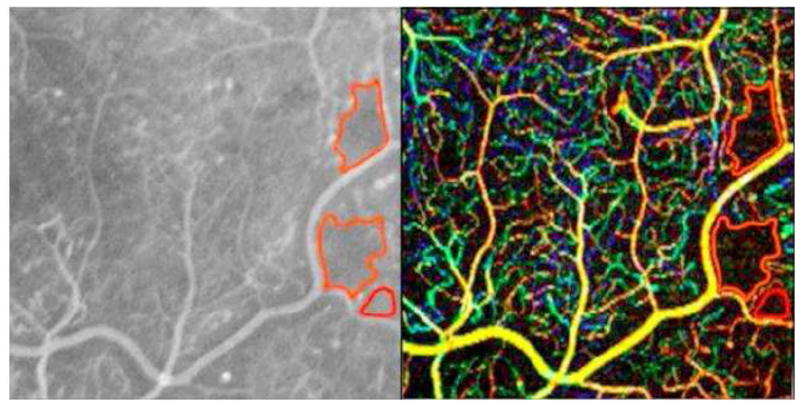
Results: Phase-variance OCT noninvasively rendered a 2-dimensional depth color-coded vasculature map of the retinal and choroidal vasculature. The choriocapillaris was imaged with better resolution of microvascular detail using PV-OCT. Areas of geographic atrophy and choroidal neovascularization imaged by FA were depicted by PV-OCT. Regions of capillary nonperfusion from diabetic retinopathy were shown by both imaging techniques; there was not complete correspondence between microaneurysms shown on FA and PV-OCT images.

Conclusions: Phase-variance OCT yields high-resolution imaging of the retinal and choroidal microvasculature that compares favorably with FA.


Conflict of interest statement

Conflicts of Interest: Drs. Schwartz, Fraser and Fingler hold an issued patent on the PC-OCT technology. They also hold founders shares in a company with an interest in the technology. Drs. Kim, Zawadski, Morse, Park and Werner have no conflict of interest.

Figures

Figure 1
Figure 1
Comparison between fluorescein angiography (FA) (A,C) and phase-contrast optical coherence tomography (PC-OCT) (B,D) over 1.5x1.5 mm2 areas in parafovea (top: 8° nasal eccentricity, bottom: 8° temporal and superior eccentricity) of a 60-year-old normal subject. PC-OCT is red-green-blue color-coded to represent the depth imaging, which is not captured in FA data sets. Red is the most superficial capillary bed, green is the intermediate capillary plexus, and blue is the deeper capillary network. Larger diameter vessels are yellowish due to positioning in both superficial and intermediate layers.
Figure 2
Figure 2
Comparison of fluorescein angiography (FA) and phase-contrast optical coherence tomography (PC-OCT) imaging of retinal and choroidal vasculature just outside the inferotemporal arcade. (A) FA in laminar phase. En face projection of PC-OCT (B) shows retinal vasculature of the same region. The color-coded image (C) shows choroidal vasculature, superficial choroidal vessels (choriocapillaris, Sattler’s layer) in green and larger choroidal vessels (Haller’s layer) in black. Notice that shadows of retinal vasculature generate artifacts in black in the upper right area in (C).
Figure 3
Figure 3
Phase-contrast optical coherence tomography showing depth imaging of retinal and choroidal vasculature. Putative choriocapillaris lobules are circled in red.
Figure 4
Figure 4
Wet age-related macular degeneration with subfoveal choroidal neovascularization (CNV). Top shows early laminar flow transit fluorescein angiography (FA) of subfoveal classic CNV. Lower left shows magnification of FA, zoomed into region of CNV. Lower right is overlay of phase-contrast optical coherence tomography (PC-OCT) montage of the subfoveal CNV. Note cartwheel shape of multiple vascular spokes emanating from probable central feeder vessel (red arrow). (PC-OCT data are based upon consecutive B-scans, each acquired with 25kHz University of California, Davis system over 1x1 mm2).
Figure 5
Figure 5
61-year-old woman with dry age-related macular degeneration (AMD). Top left shows red free photo; top right is laminar flow phase of fluorescein angiography (FA). Lower left is high magnification FA image of foveal region; lower right shows a 3 x 3 mm phase-contrast optical coherence tomography (PC-OCT) depth image of same region, color coded. (Green is superficial/anterior choroidal region, which includes horizontal motion artifacts. Yellow is deeper into choroid, and red is the deepest imaging plane.) All slices are fixed distances relative to the anterior surface of retina.
Figure 6
Figure 6
View of temporal retina in a patient with proliferative diabetic retinopathy. Fluorescein angiography (FA) on left shows multiple microaneurysms; regions of capillary non-perfusion outlined in red. 3 x 3 mm phase-contrast optical coherence tomography (PC-OCT) on right shows similarly shaped regions of capillary non-perfusion outlined in red. While some microaneurysms are shown by FA and PC-OCT (white circles), others are only shown in the FA image (blue circles) or PC-OCT (red circles).

References

    1. Alvis D. Happy 50th birthday [letter] Ophthalmology. 2009;116:2259. - PubMed
    1. Marmor MF, Ravin JG. Fluorescein angiography: insight and serendipity a half century ago. Arch Ophthalmol. 2011;129:943–8. - PubMed
    1. Swanson EA, Huang D. Ophthalmic OCT reaches $1 billion per year. Retin Physician. 2011;8(4):45, 58–59, 62.
    1. Lipson BK, Yannuzzi LA. Complications of intravenous fluorescein injections. Int Ophthalmol Clin. 1989;29(3):200–5. - PubMed
    1. Owens SL. Indocyanine green angiography. Br J Ophthalmol. 1996;80:263–6. - PMC - PubMed