. 2014 May;28(5):1122-8.
doi: 10.1038/leu.2013.313. Epub 2013 Oct 25.

Continued improvement in survival in multiple myeloma: changes in early mortality and outcomes in older patients

Affiliations

Continued improvement in survival in multiple myeloma: changes in early mortality and outcomes in older patients

S K Kumar et al. Leukemia. 2014 May.

Abstract

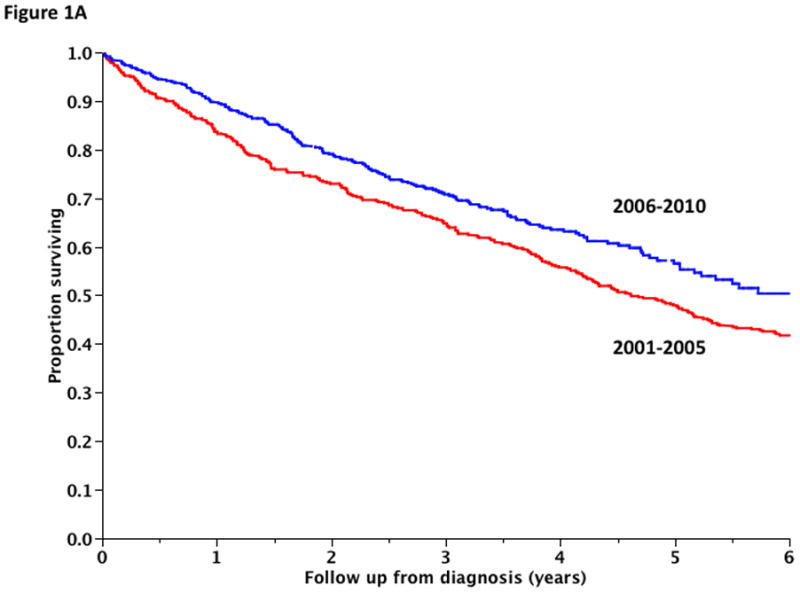
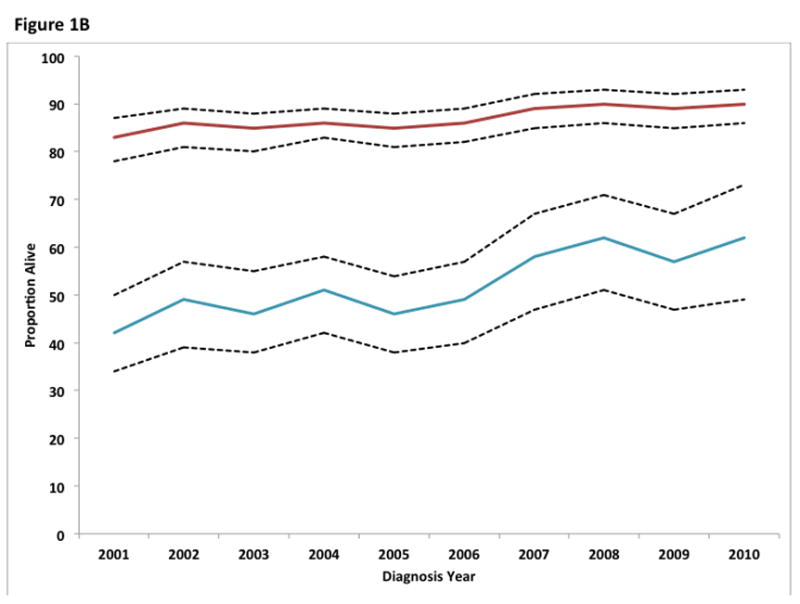
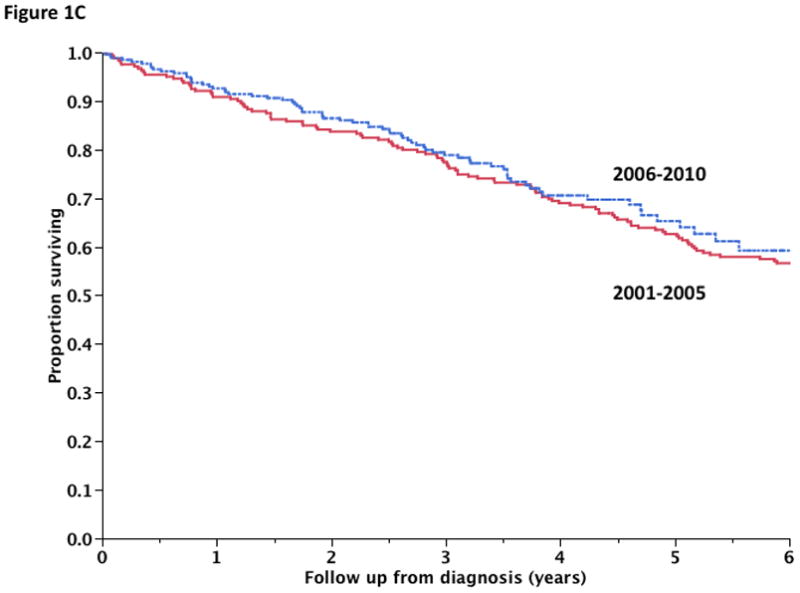
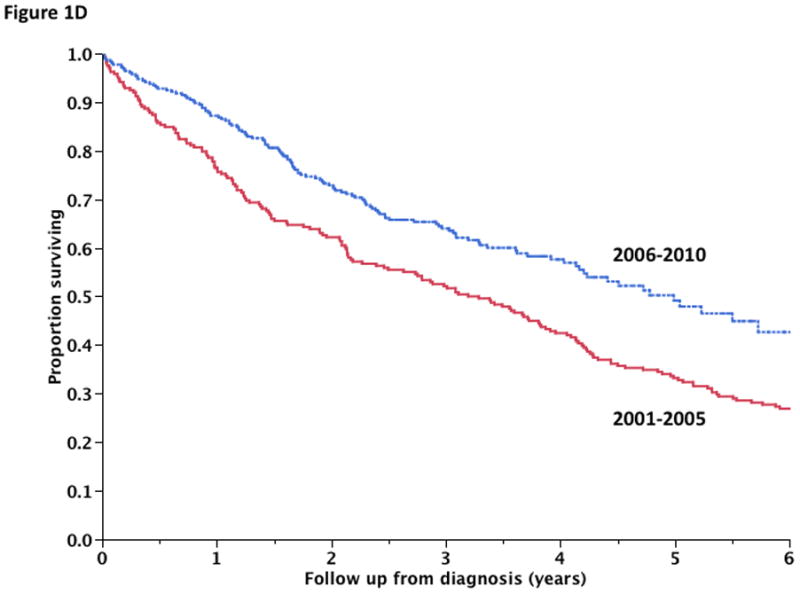
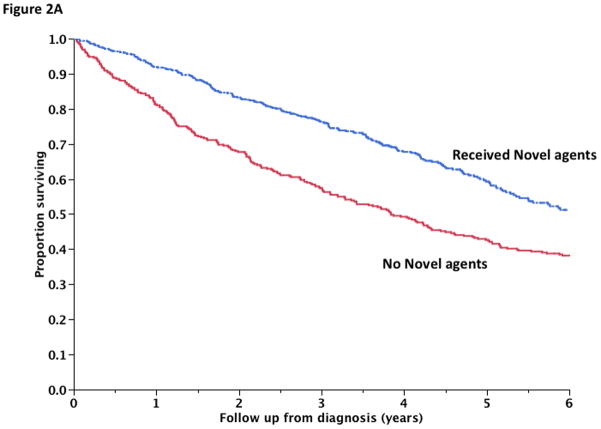
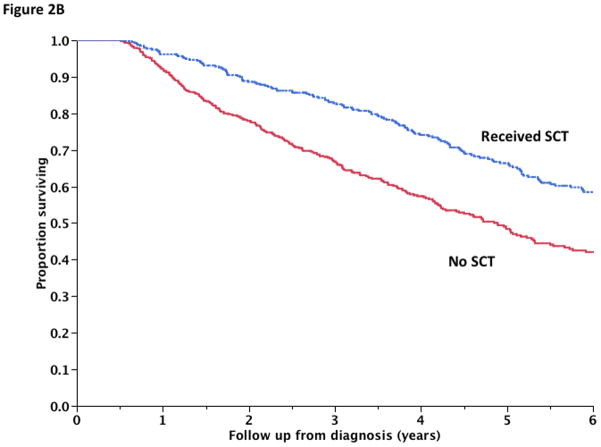
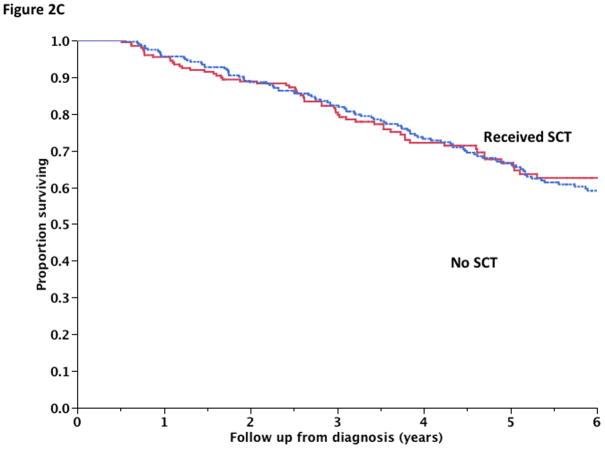
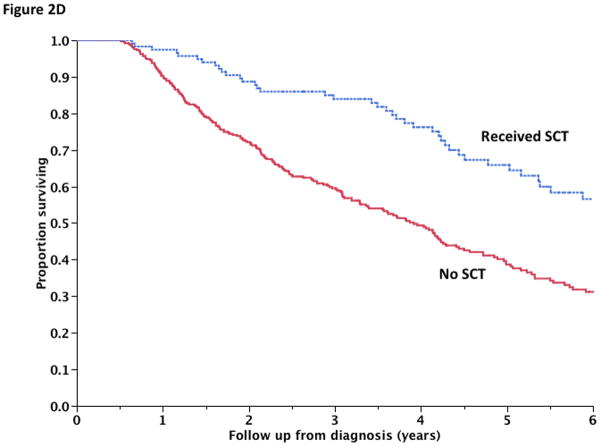
Therapy for multiple myeloma (MM) has markedly changed in the past decade with the introduction of new drugs, but it is not clear whether the improvements have been sustained. We studied 1038 patients diagnosed between 2001 and 2010, grouping patients into two 5-year periods by diagnosis, 2001-2005 and 2006-2010. The median estimated follow-up for the cohort was 5.9 years with 47% alive at the last follow-up. The median overall survival (OS) for the entire cohort was 5.2 years: 4.6 years for patients in the 2001-2005 group compared with 6.1 years for the 2006-2010 cohort (P=0.002). The improvement was primarily seen among patients over 65 years, the 6-year OS improving from 31 to 56%, P<0.001. Only 10% of patients died during the first year in the latter group, compared with 16% in the earlier cohort (P<0.01), suggesting improvement in early mortality. The improved outcomes were linked closely to the use of one or more new agents in initial therapy. The current results confirm continued survival improvement in MM and highlight the impact of initial therapy with novel agents. Most importantly, we demonstrate that the improved survival is benefitting older patients and that early mortality in this disease has reduced considerably.


Figures

Figure 1
Figure 1
Panel A shows the overall survival comparison between patients diagnosed during January 2001– December 2005 and those diagnosed during January 2006 and December 2010. Panel B shows the trends in the 1 and 5 year overall survival estimates between January 2001 and December 2010 with patients grouped by the year of diagnosis. The dotted lines represent the 95% confidence intervals. Panel C shows the overall survival comparison between patients diagnosed during 2001– 2005 and those diagnosed during 2006–2010 limited to patients 65 years or younger. Panel D shows the overall survival comparison between patients diagnosed during 2001– 2005 and those diagnosed during 2006–2010 limited to patients older than 65 years.
Figure 1
Figure 1
Panel A shows the overall survival comparison between patients diagnosed during January 2001– December 2005 and those diagnosed during January 2006 and December 2010. Panel B shows the trends in the 1 and 5 year overall survival estimates between January 2001 and December 2010 with patients grouped by the year of diagnosis. The dotted lines represent the 95% confidence intervals. Panel C shows the overall survival comparison between patients diagnosed during 2001– 2005 and those diagnosed during 2006–2010 limited to patients 65 years or younger. Panel D shows the overall survival comparison between patients diagnosed during 2001– 2005 and those diagnosed during 2006–2010 limited to patients older than 65 years.
Figure 2
Figure 2
Panel A shows the overall survival comparison between patients receiving one of the newer drugs (thalidomide, lenalidomide or bortezomib) as part of initial therapy and patients not receiving one of these regimens. Panel B shows the survival comparison between patients receiving an autologous stem cell transplantation versus those did not; with land marking at 6 months. Panels C and D demonstrates the survival comparison between patients receiving a stem cell transplant versus those who have not received a stem cell transplant among those 65 years or younger (Panel C) and those over 65 years (Panel D). Panel E shows the increasing risk of early mortality (1 year mortality) with increasing number of risk factors (identified age >70, serum albumin < 3.5 gm/dL, and serum beta 2 microglobulin > 6.5 mg/dL)
Figure 2
Figure 2
Panel A shows the overall survival comparison between patients receiving one of the newer drugs (thalidomide, lenalidomide or bortezomib) as part of initial therapy and patients not receiving one of these regimens. Panel B shows the survival comparison between patients receiving an autologous stem cell transplantation versus those did not; with land marking at 6 months. Panels C and D demonstrates the survival comparison between patients receiving a stem cell transplant versus those who have not received a stem cell transplant among those 65 years or younger (Panel C) and those over 65 years (Panel D). Panel E shows the increasing risk of early mortality (1 year mortality) with increasing number of risk factors (identified age >70, serum albumin < 3.5 gm/dL, and serum beta 2 microglobulin > 6.5 mg/dL)
Figure 3
Figure 3
Panel A and B shows the survival according to the International Staging System (ISS) among patients diagnosed during 2001–2005 (Panel A) and those diagnosed later (Panel B). Panel C and D shows the survival according to the FISH based risk status among patients diagnosed during 2001–2005 (Panel C) and those diagnosed later (Panel D).
Figure 3
Figure 3
Panel A and B shows the survival according to the International Staging System (ISS) among patients diagnosed during 2001–2005 (Panel A) and those diagnosed later (Panel B). Panel C and D shows the survival according to the FISH based risk status among patients diagnosed during 2001–2005 (Panel C) and those diagnosed later (Panel D).

Similar articles

Cited by

References

    1. Mikhael JR, Dingli D, Roy V, Reeder CB, Buadi FK, Hayman SR, et al. Management of Newly Diagnosed Symptomatic Multiple Myeloma: Updated Mayo Stratification of Myeloma and Risk-Adapted Therapy (mSMART) Consensus Guidelines 2013. Mayo Clin Proc. 2013 Apr;88(4):360–376. - PubMed
    1. Anderson KC. The 39th David A. Karnofsky Lecture: bench-to-bedside translation of targeted therapies in multiple myeloma. J Clin Oncol. 2012 Feb 1;30(4):445–452. - PMC - PubMed
    1. Kyle RA. Targeted therapy of multiple myeloma. Hematology. 2012 Apr;17(Suppl 1):S125–128. - PubMed
    1. Kumar SK, Rajkumar SV, Dispenzieri A, Lacy MQ, Hayman SR, Buadi FK, et al. Improved survival in multiple myeloma and the impact of novel therapies. Blood. 2008 Mar 1;111(5):2516–2520. - PMC - PubMed
    1. Brenner H, Gondos A, Pulte D. Recent major improvement in long-term survival of younger patients with multiple myeloma. Blood. 2008 Mar 1;111(5):2521–2526. - PubMed

Publication types