. 2014 Jan;12(1):101-18.
doi: 10.1016/j.scr.2013.09.014. Epub 2013 Oct 3.

Patch-clamp recordings and calcium imaging followed by single-cell PCR reveal the developmental profile of 13 genes in iPSC-derived human neurons

Affiliations

Patch-clamp recordings and calcium imaging followed by single-cell PCR reveal the developmental profile of 13 genes in iPSC-derived human neurons

Glenn S Belinsky et al. Stem Cell Res. 2014 Jan.

Abstract

Molecular genetic studies are typically performed on homogenized biological samples, resulting in contamination from non-neuronal cells. To improve expression profiling of neurons we combined patch recordings with single-cell PCR. Two iPSC lines (healthy subject and 22q11.2 deletion) were differentiated into neurons. Patch electrode recordings were performed on 229 human cells from Day-13 to Day-88, followed by capture and single-cell PCR for 13 genes: ACTB, HPRT, vGLUT1, βTUBIII, COMT, DISC1, GAD1, PAX6, DTNBP1, ERBB4, FOXP1, FOXP2, and GIRK2. Neurons derived from both iPSC lines expressed βTUBIII, fired action potentials, and experienced spontaneous depolarizations (UP states) ~2 weeks before vGLUT1, GAD1 and GIRK2 appeared. Multisite calcium imaging revealed that these UP states were not synchronized among hESC-H9-derived neurons. The expression of FOXP1, FOXP2 and vGLUT1 was lost after 50 days in culture, in contrast to other continuously expressed genes. When gene expression was combined with electrophysiology, two subsets of genes were apparent; those irrelevant to spontaneous depolarizations (including vGLUT1, GIRK2, FOXP2 and DISC1) and those associated with spontaneous depolarizations (GAD1 and ERBB4). The results demonstrate that in the earliest stages of neuron development, it is useful to combine genetic analysis with physiological characterizations, on a cell-to-cell basis.

Keywords: AP; CC; EB; MEFs; NE; R(IN); V(R); VC; action potential; current clamp; embryoid bodies; input resistance.; mouse embryonic fibroblasts; neuroepithelial (rosettes); resting membrane potential; voltage clamp.


Figures

Figure 1
Figure 1. Differentiation of two iPSC lines
A) Schematic of differentiation protocol used on iPSC to create neurons. Dm = dorsomorphin, SB = SB431542. ES – embryonic stem cells; EB – embryoid bodies; NE – neuroepithelial colonies; and Exp. – expansion colonies. B–C: Immunofluorescent staining of iPSC-01 (B) and iPSC-15 (C) for βTUBIII. D–E: Immunofluorescent staining of iPSC-01 (D) and iPSC-15 (E) for NeuN, 32 days after start of differentiation. Bar = 100 µm.
Figure 2
Figure 2. Physiological characterization of iPSC cultures
Each panel (A–D) consists of 2 segments. Top: DIC photograph of a differentiating neuron. Scale, 10 µm. Bottom: Change in membrane potential evoked by injection of variable current pulses. To confirm the category of the AP waveform, the intensity of the depolarizing current was increased above the threshold for generation of a regenerative spike (gray trace). E) Based on the presence of regenerative potential (spike) the human cells from both iPSC lines can be divided in 2 groups. F) Distribution of specific action potential waveforms between control (iPSC-01) and schizophrenia patient (iPSC-15). Values are calculated by dividing the number of cells in each group by the total number of iPSC-01 or iPSC-15 cells. Passive indicates lack of regenerative potential. iPSC-01 n=106, iPSC-15 n=123.
Figure 3
Figure 3. Lack of systematic differences between iPSC-01 and iPSC-15
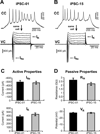
A–B) Traces obtained from individual iPSC-01 and iPSC-15 during current clamp (CC) and voltage clamp (VC). C) Peak sodium and peak potassium currents were averaged across all cells within each cell line (iPSC-01 n=106 and iPSC-15 n=123). D) Average input resistance and resting membrane potential. Error bars = s.e.m.
Fig. 4
Fig. 4. Spontaneous Electrical Activity
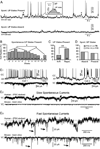
A) Each trace is a single sweep (1 out of 5 minutes of total recording episode) of spontaneous activity in current clamp mode. Spontaneous activity consists of plateau depolarizations (UP states) that are typically in the range of 8 – 20 mV (peak amplitude), and duration in the range of 1 – 5 s. Subthreshold UP states are marked by rectangular symbols. One suprathreshold (accompanied by AP firing) UP state is blown up in the inset. B) Fraction of cells with spontaneous activity declines as a function of time in iPSC-1 and iPSC-15 cells combined together. When comparing weeks 2–7 vs. 8–13, * p<0.05 by Chi-squared test. C) Fractions of spontaneously active cells with non-repetitive APs versus those with repetitive APs. iPSC-01 and iPSC-15 cells are combined (pooled). ** P<<0.001 by Chi-squared test. D) Comparing the frequencies of cells endowed with spontaneous activity between iPSC-1 and IPSC-15 cells. Values at base of bars indicate total number of cells assayed (n). E1) Sequential recordings of spontaneous activity. Current clamp (CC) followed by voltage clamp (VC); performed in two IPSC-01-derived neurons, (Cell 1 (Day-14) and Cell 2 (Day-47)). E2) Spontaneous currents are compared (on the same scale) between an IPSC-derived human neuron in culture (Upper trace, same cell as Cell 2 in previous panel) and a cortical interneuron in brain slice (Lower trace; C57BL/6 mouse, P34). Command potential = −70 mV. Arrows mark slow current transients in IPSC neurons only. E3) Same as E2 except faster time scale. Arrows mark fast current transients in both IPSC and mouse neurons.
Figure 5
Figure 5. Calcium transients in young human neurons
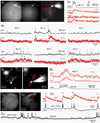
(A1) IPSC-01 line, 69 days in differentiation (Day-69), filled with OGB1 and AF-594. Left: Infra-red DIC. Middle: AF-594 fluorescence. Right: Fluorescence captured during Ca2+ imaging by fast data acquisition camera (80 × 80 pixels). (A2) APs were evoked by current injection in to the soma. Temporal average of the whole-cell recording (black) is aligned with Ca2+ signals from three ROIs marked by boxes in A1. Individual whole-cell traces displayed in Suppl. Fig. S3. (A3) Calcium imaging of spontaneous neuronal activity (red) aligned with whole-cell (black). Six sweeps are shown. Asterisks mark UP states detected in Ca2+ recordings. (B1) Composite image of a neuron derived from the IPSC-15 line (Day-76); filled with OGB1 and AF-594. Images captured after the electrode was removed. (B2) Same cell during Ca2+ imaging. (B3) Same as in A2. (C1) Infra-red DIC image of hESC-H9 line (Day-68). (C2) Same cell in AF-594 channel. (C3) Same as in A3, except only one sweep shown. (C4) Same cell (hESC-H9) – a 5 min episode of spontaneous electrical activity recorder via patch pipette.
Figure 6
Figure 6. Multi-site Ca2+ imaging of spontaneous neuronal activity
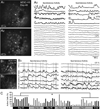
(A1) hESC-H9 line, 46 days in differentiation (Day-46), filled with OGB1-AM. Image captured by fast data acquisition camera (80 × 80 pixels). (A2) Boxes indicate regions of interest (ROIs) used to display recordings in the next panel. (A3) Calcium imaging (duration 320 s). Spontaneous activity recorded simultaneously from 41 cells. Ten cells showed spontaneous fluctuations of internal Ca2+ (black traces). 31 cells did not exhibit spontaneous Ca2+ transients (gray traces). (B1B2) same as (A1A2), except different coverslip. Ten out of 79 cells in this visual field exhibited spontaneous Ca2+ transients. Vertical lines mark multiple time points in which a calcium transient in one cell is not synchronized with transients in other cells. (C) Percentage of cells with spontaneous Ca2+ transients per visual field. Each bar represents one of the 51 visual fields recorded in 9 coverslips. Days in differentiation (Day) is indicated below the bars. Asterisk, unpaired t-Test, p=0.034. If the first 5 points on Day-57 (small values 0–6%) were included in this t-Test then p-value would be more significant (p=0.002). For a t-Test comparing combined Days 23, 34 & 46 on one side against combined Days 55, 56, 57,& 62 on the other side, then p=0.011.
Figure 7
Figure 7. Time course of gene expression
Dot plot showing ages of all cells positive for the gene indicated on the left. Legend: Each individual cell positive for the gene is marked by one diamond. Time bins are colored white if the gene was not detected in any neuron tested. Time bins are colored gray if the gene was detected in neurons. At the bottom of the plot are the numbers of total cells assayed (in 10 day increments) regardless of gene expression. The presence of a gene at a particular day in vitro is marked by gray background.
Figure 8
Figure 8. Spontaneous electrical activity and gene expression
A) Spontaneous electrical activity without UP states (without plateau depolarizations). B) Subgroup of genes showing no association with the presence of UP states. X-axis: gene name. Y-axis: percent of gene-positive cells that either exhibit UP states (light column) or not (dark column). C) Subgroup of genes potentially associated with the presence of UP states. Majority of cells positive for a gene from this group exhibit plateau depolarizations (UP states). D) Same as in C except spontaneous activity is now defined by presence of at least one action potential (AP), or one plateau depolarization during 5-min recording. *ERBB4 p=0.044 by Fisher’s Exact Test; *GAD1 p=0.013 by Chi-squared test.

References

    1. Abe Y, Namba H, Kato T, Iwakura Y, Nawa H. Neuregulin-1 signals from the periphery regulate AMPA receptor sensitivity and expression in GABAergic interneurons in developing neocortex. J Neurosci. 2011;31:5699–5709. - PMC - PubMed
    1. Bassett AS, Chow EW. Schizophrenia and 22q11.2 deletion syndrome. Curr Psychiatry Rep. 2008;10:148–157. - PMC - PubMed
    1. Belinsky GS, Moore AR, Short SM, Rich MT, Antic SD. Physiological Properties of Neurons Derived from Human Embryonic Stem Cells using a dbcAMP-based Protocol. Stem Cells and Development. 2011;20(10):1733–1746. - PubMed
    1. Benes FM, McSparren J, Bird ED, SanGiovanni JP, Vincent SL. Deficits in small interneurons in prefrontal and cingulate cortices of schizophrenic and schizoaffective patients. Arch Gen Psychiatry. 1991;48:996–1001. - PubMed
    1. Brennand KJ, Gage FH. Modeling psychiatric disorders through reprogramming. Disease models & mechanisms. 2012;5(1):26–32. - PMC - PubMed

Publication types

MeSH terms