. 2013:4:2667.
doi: 10.1038/ncomms3667.

Differential regulation of the REGγ-proteasome pathway by p53/TGF-β signalling and mutant p53 in cancer cells

Affiliations
Free PMC article

Differential regulation of the REGγ-proteasome pathway by p53/TGF-β signalling and mutant p53 in cancer cells

Amjad Ali et al. Nat Commun. 2013.
Free PMC article

Abstract

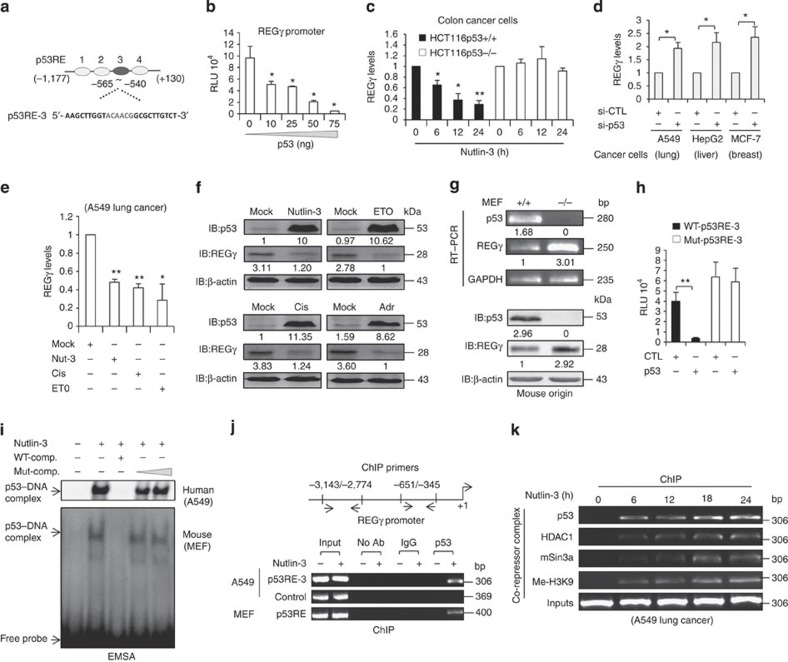
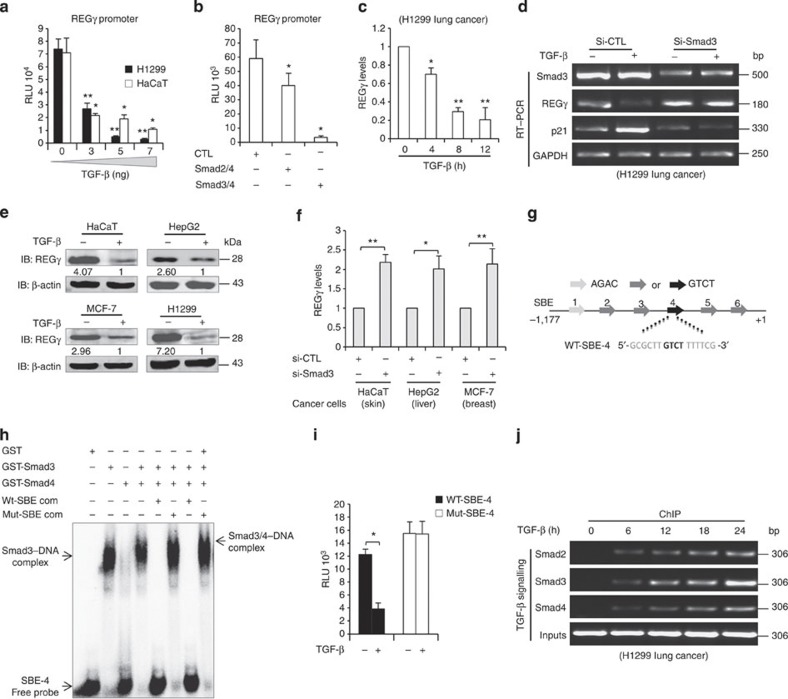
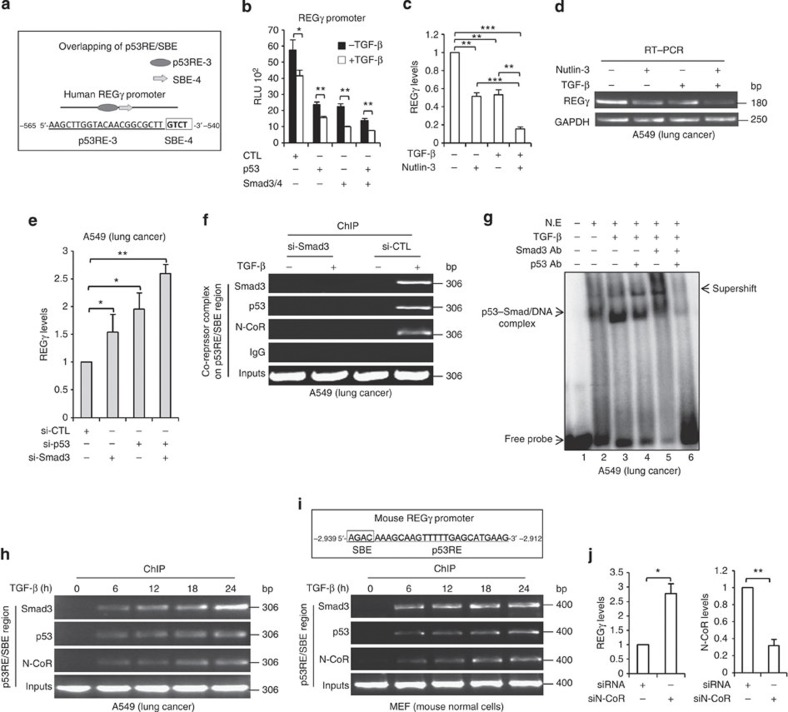
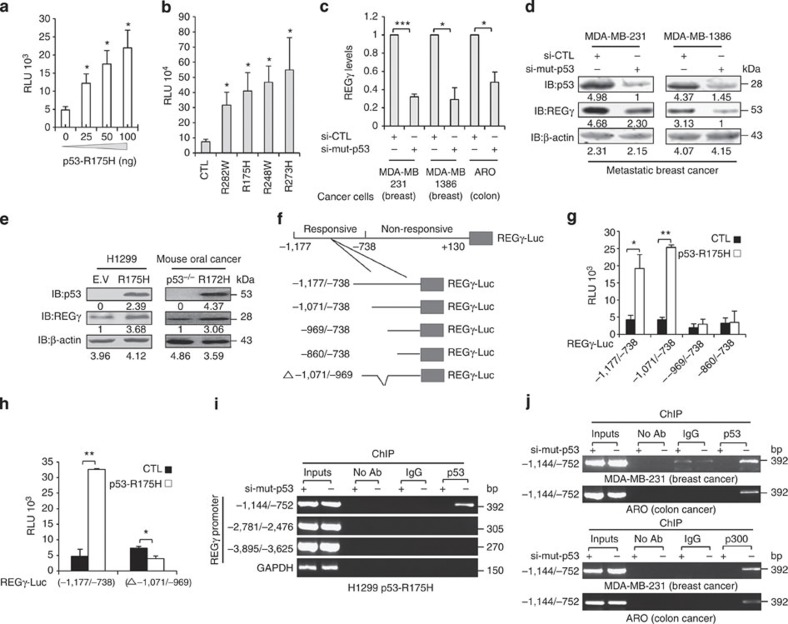
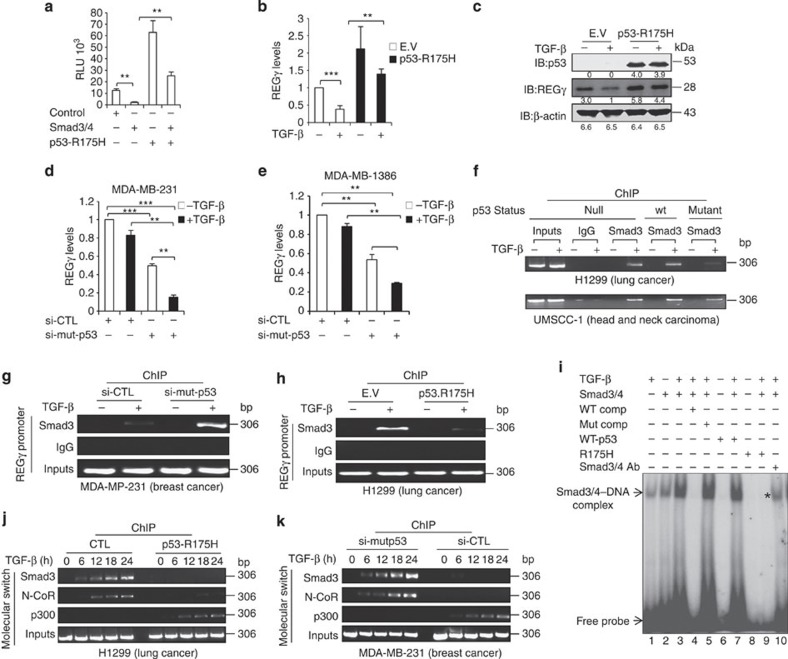
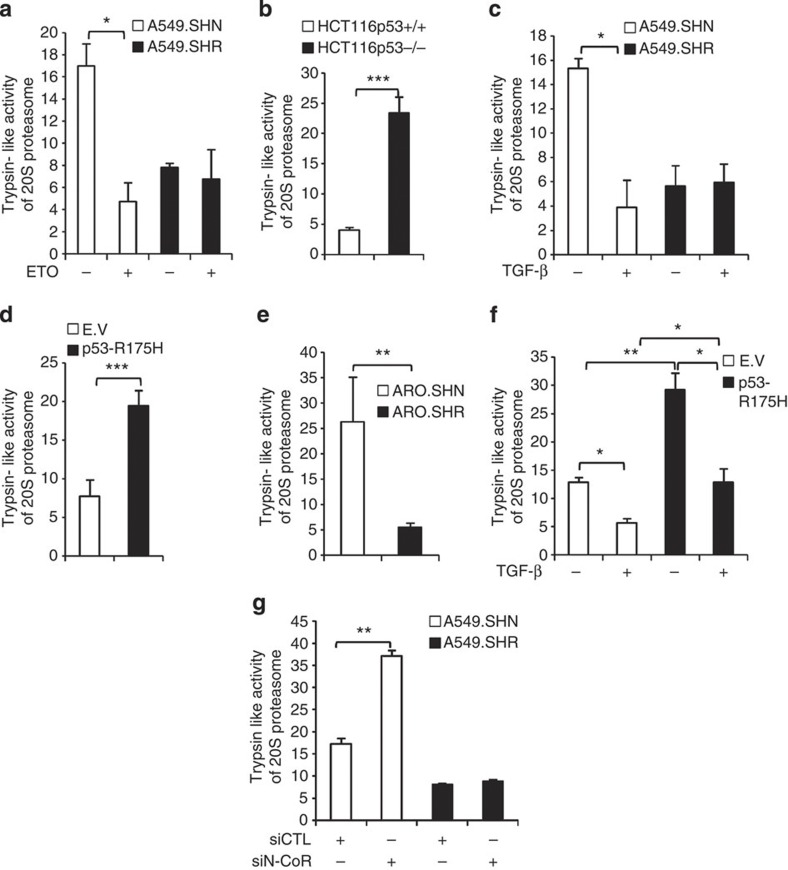
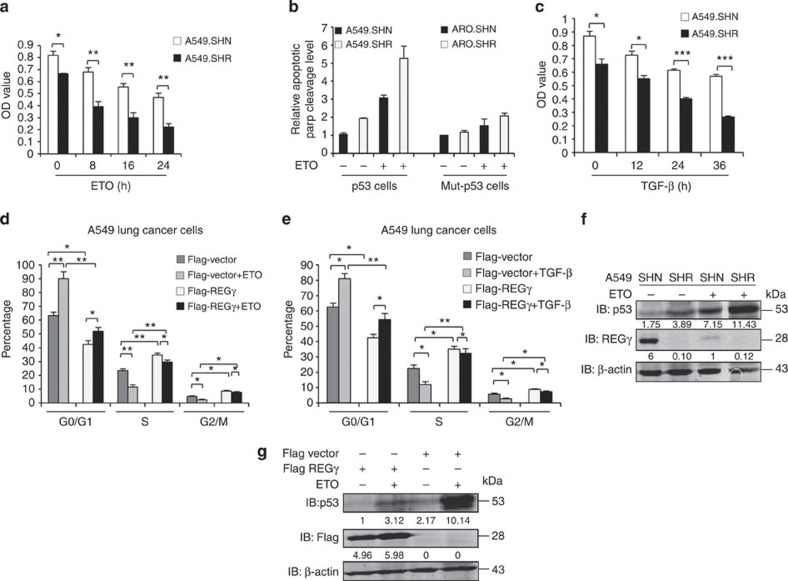
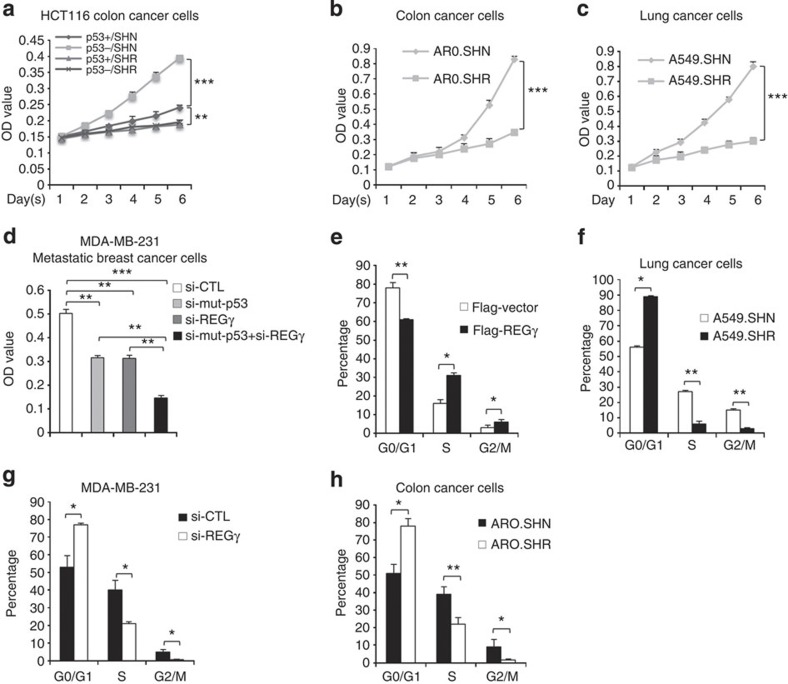
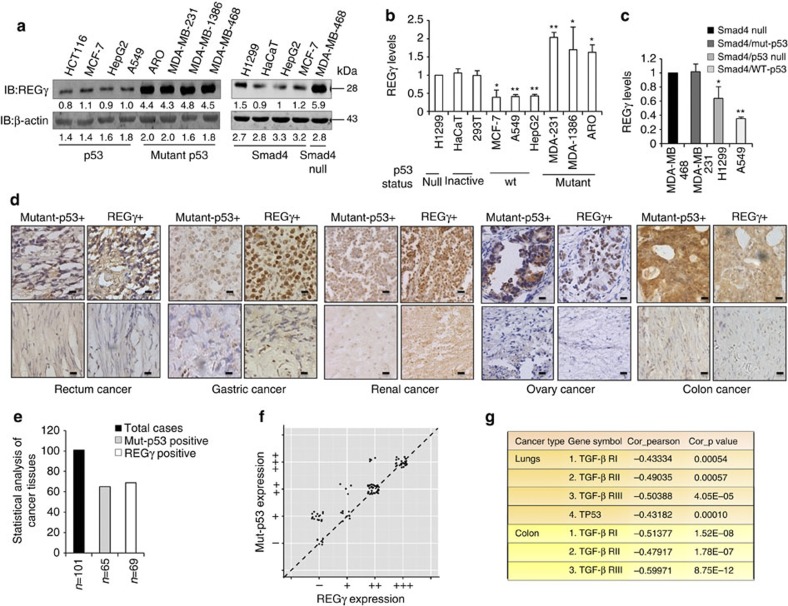
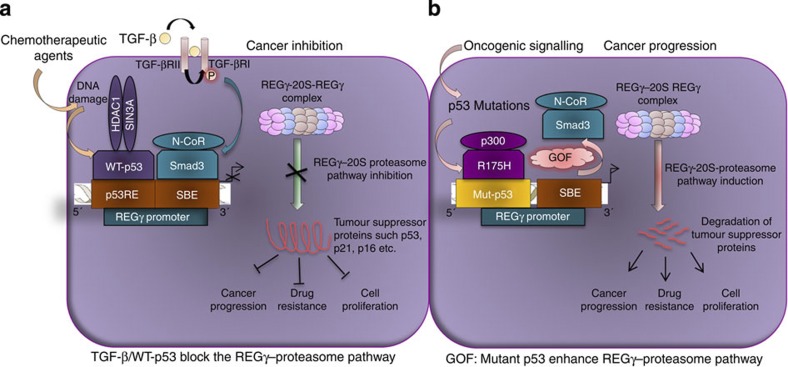
Proteasome activity is frequently enhanced in cancer to accelerate metastasis and tumorigenesis. REGγ, a proteasome activator known to promote p53/p21/p16 degradation, is often overexpressed in cancer cells. Here we show that p53/TGF-β signalling inhibits the REGγ-20S proteasome pathway by repressing REGγ expression. Smad3 and p53 interact on the REGγ promoter via the p53RE/SBE region. Conversely, mutant p53 binds to the REGγ promoter and recruits p300. Importantly, mutant p53 prevents Smad3/N-CoR complex formation on the REGγ promoter, which enhances the activity of the REGγ-20S proteasome pathway and contributes to mutant p53 gain of function. Depletion of REGγ alters the cellular response to p53/TGF-β signalling in drug resistance, proliferation, cell cycle progression and proteasome activity. Moreover, p53 mutations show a positive correlation with REGγ expression in cancer samples. These findings suggest that targeting REGγ-20S proteasome for cancer therapy may be applicable to human tumours with abnormal p53/Smad protein status. Furthermore, this study demonstrates a link between p53/TGF-β signalling and the REGγ-20S proteasome pathway, and provides insight into the REGγ/p53 feedback loop.


Figures

Figure 1
Figure 1
(a) Schematic representation of putative p53-responsive elements (p53REs) with 1.3 kb region of the REGγ promoter. Dark grey colour represents critical p53RE-3. (b) H1299 cells were co-transfected with REGγ reporter construct along with an empty vector or increasing amounts of p53 for 24 h before lysis and were analysed for luciferase activity. The average was calculated based on three independent experiments. Error bars show the mean±s.d. from three technical replicates (two-tailed Student’s t-test, *P<0.05). (c) HCT116 p53 (+/+) and HCT116 p53 (−/−) were treated with 10 μmol l−1 Nutlin-3 for indicated time points to perform quantitative RT–PCR analysis. The average was calculated based on three independent experiments. Data are representative of three technical repeats with mean±s.d. (two-tailed Student’s t-test, *P<0.05, **P<0.005). (d) A549, HepG2 and MCF-7 cells were transfected independently with siRNA specific for p53 (20 nM for 48 h) and total RNA was isolated. Data represent average of three independent experiments. Data show the mean±s.d. from three technical replicates (two-tailed Student’s t-test, *P<0.05). (e,f) A549 cells were treated with different anticancer drugs such as Nutlin-3 (10 μmol l−1), Cisplatin (5 μg ml−1), ETO (10 μmol) and Adriamycin (1 μM), and were analysed by (e) RT–PCR and by (f) western blotting. (e) Error bars show the mean±s.d. from three technical replicates. (Two-tailed Student's t-test, *P<0.05, **P<0.005). (g) Comparative analysis of REGγ mRNA and protein levels in mouse embryonic fibroblast (MEF) p53 (+/+) and MEF p53 (−/−) cells. (h) H1299 cells were co-transfected with wild-type (2 μg) or mutated p53RE (2 μg) REGγ luciferase reporter constructs along with the p53 plasmid (75 ng) for 24 h and then analysed for luciferase activity. Data are representative of three independent experiments. Error bars show the mean±s.d. from three technical replicates. (two-tailed Student’s t-test, **P<0.005). (i) A549 cells (upper panel) and MEF cells (lower panel) were treated with Nutlin-3 for 24 h, and EMSA assays were performed with the double-stranded oligonucleotides containing the p53RE from the REGγ promoter. (j) Schematic representation of ChIP primers. A549 cells (upper two panels) and MEF cells (lower panel) were independently treated with Nutlin-3a for 24 h, and ChIP assays were performed with anti-p53 antibody. (k) ChIP analysis of REGγ promoter in A549 cells at indicated time periods after Nutlin-3 (10 μmol l−1) treatment.
Figure 2
Figure 2. Smad complex represses the REGγ–proteasome pathway through SBE.
(a) H1299 and HaCaT cells were transfected independently with REGγ reporter construct (2 μg), treated with different doses of TGF-β for 24 h before lysis and were analysed for luciferase activity. Data are representative of three technical repeats with mean±s.d. (two-tailed Student’s t-test, *P<0.05, **P<0.005). (b) H1299 cells were co-transfected with REGγ reporter construct (2 μg) in combination with either Smad2/4 (100 ng) or Smad3/4 (100 ng) expression plasmids for 24 h and then analysed for luciferase activity. Data are representative of three technical repeats with mean±s.d. (two-tailed Student’s t-test, *P<0.05). (c) H1299 were incubated in the absence or presence of 5 ng ml−1 TGF-β for indicated time points. Total RNA was isolated and subjected to quantitative RT–PCR. Data are representative of three technical replicates with mean±s.d. (two-tailed Student’s t-test, *P<0.05, **P<0.005). (d) H1299 cells were transfected with siRNA directed against Smad3 (20 nM). After 48 h of transfection, cells were treated with 5 ng ml−1 TGF-β for 12 h and semiquantitative RT–PCR was performed to analyse REGγ, Smad3 and p21 mRNA levels. (e) HaCaT, HepG2, MCF-7 and H1299 cells were treated with 5 ng ml−1 TGF-β and analysed by western blotting. (f) HaCaT, HepG2 and MCF-7 cells were transfected independently with siRNA specific for Smad3 (20 nM, for 48 h) and total RNA was isolated. Error bars show the mean±s.d. from three technical replicates (two-tailed Student’s t-test, *P<0.05, **P<0.005). (g) Schematic representation of putative SBE boxes in the REGγ promoter. The black arrows indicate the functional SBE in the REGγ promoter. (h) EMSA assay was performed using purified glutathione S-transferase (GST)-Smad3 protein. Fifty nanograms of GST-Smad3 protein were incubated with 32P-radiolabelled probe containing SBE box from the REGγ promoter. (i) H1299 cells were transfected with wild-type (2 μg) or mutated (2 μg) SBE REGγ luciferase reporter constructs. Cells were then left untreated or treated with 5 ng ml−1 TGF-β for 24 h and luciferase activity was measured. Error bars show the mean±s.d. from three technical replicates. Data are representative of three independent experiments (two-tailed Student’s t-test, *P<0.05). (j) H1299 cells were treated with 5 ng ml−1 TGF-β for indicated time and ChIP analyses were performed with indicated antibodies.
Figure 3
Figure 3. TGF-β stimulates the formation of p53/Smad3/N-CoR on REGγ promoter via p53RE/SBE site.
(a) Schematic representation of p53RE/SBE overlapping region on REGγ promoter. (b) H1299 cells were co-transfected with expression vectors encoding p53/Smad3/4, both alone and in combination, left untreated or treated with 5 ng ml−1 TGF-β for 24 h before lyses and were analysed for luciferase activity. Error bars show the mean±s.d. from three technical replicates. Data are representative of three independent experiments (two-tailed Student’s t-test, *P<0.05, **P<0.005). (c,d) A549 cells were treated with 5 ng ml−1 TGF-β and 10 μmol l−1 Nutlin-3 either alone or in combination for 24 h and RT–PCR analysis was performed. Error bars show the mean±s.d. from three technical replicates (two-tailed Student’s t-test, **P<0.005, ***P<0.0005). (e) A549 cells were transfected with siRNA directed against Smad3 (20 nM) or p53 (20 nM), either alone or in combination for 48 h. Total RNA was extracted for quantitative RT–PCR to analyse REGγ mRNA level. Data are representative of three technical repeats with mean±s.d. (two-tailed Student’s t-test, *P<0.05, **P<0.005). (f) ChIP analysis indicating that knockdown of Smad3 prevents the recruitment of Smad3, p53 and N-CoR to the REGγ promoter in response to TGF-β in A549 cell lines. (g) A549 cells were treated with 5 ng ml−1 TGF-β for 24 h and nuclear extracts were subjected to EMSA analysis with 32P-end-labelled probes corresponding to the p53RE/SBE region from the REGγ promoter. Antibodies against Smad3 and p53 were added as indicated. (h) TGF-β enhances Smad3/p53/N-CoR recruitment at the p53RE/SBE on human REGγ promoter. (h) A549 cells were treated with 5 ng ml−1 TGF-β for the indicated time and ChIP analyses were performed with the antibodies specific for Smad3, p53 and N-CoR. (i) Schematic representation of p53RE/SBE site on mouse REGγ promoter (upper panel) and showing the recruitment of Smad3, p53 and N-CoR in mouse mouse embryonic fibroblast (MEF) cell lines in response to TGF-β (lower panel). (j) A549 cells were treated with (20 nM) N-CoR siRNA for 48 h and were analysed by RT–PCR (left panel). Knockdown efficiency of N-CoR in A549 cells (right panel). Error bars show the mean±s.d. from three technical replicates (two-tailed Student’s t-test, *P<0.05, **P<0.005).
Figure 4
Figure 4. Mutant p53 enhances REGγ expression via p300 recruitment.
(a) H1299 cells were co-transfected with the REGγ reporter construct (2 μg) along with empty vector or increasing amounts of p53-R175H for 24 h before lysis and were analysed for luciferase activity. Data are representative of three technical replicates with mean±s.d. (two-tailed Student’s t-test, *P<0.05). (b) H1299 cells were co-transfected with REGγ promoter (2 μg) in combination with different mutant p53 proteins such as p53-R282W (50 ng), p53-R175H (50 ng), p53-R248W (50 ng) and p53-R273H (50 ng) for 24 h before lysis and were analysed for luciferase activity. Error bars show the mean±s.d. from three technical replicates (two-tailed Student’s t-test, *P<0.05). (c) MDA-MB-231, MDA-MB-1386 and ARO cells were transfected with the siRNA specific for p53 (20 nM), and after 48 h, total RNA was subjected to quantitative RT–PCR analysis. Error bars show the mean±s.d. from three technical replicates (two-tailed Student’s t-test, *P<0.05, ***P<0.0005). (d) MDA-MB-231 and MDA-MB-1386 cells were transfected with siRNA directed against p53 (20 nM) for 72 h and were analysed by western blotting. (e) H1299 cells stably expressing either empty vector (E.V) or p53-R175H, and immortalized oral cancer cells from p53 (−/−) or p53-R172H mice were subjected to western blot analysis (right panel). (f) Schematic representation of different deletion constructs of REGγ promoter. (g) Full-length (−1,177/−738) and different truncated constructs of REGγ within this region (each 2 μg) were co-transfected in H1299 cells along with p53-R175H (100 ng) for 24 h before lyses were and then analysed for luciferase activity. Error bars show the mean±s.d. from three technical replicates (two-tailed Student’s t-test, *P<0.05, **P<0.005). (h) Deletion of (−1,071/−969) region abolishes the transactivation of REGγ by mutant p53. Error bars show the mean±s.d. from three technical replicates (two-tailed Student’s t-test, *P<0.05, **P<0.005). (i) Binding of mutant p53 to the REGγ promoter in H1299 p53-R175H was measured by ChIP analysis. (j) Binding of endogenous mutant p53 to the REGγ promoter in MDA-MB-231 and ARO cells were measured by ChIP analysis (upper two panels) and recruitment of p300 to REGγ promoter by ChIP analysis (lower two panels).
Figure 5
Figure 5. Mutant p53 antagonizes recruitment of the Smad3/N-CoR complex on the REGγ promoter.
(a) H1299 were co-transfected with Smad3/4 and p53-R175H expression plasmids independently or in combination and were analysed for luciferase activity. Data are representative of three technical repeats with mean±s.d. (two-tailed Student’s t-test, **P<0.005). (b,c) H1299 cells stably expressing either p53-R175H mutant or empty vectors (E.V) were left untreated or treated with 5 ng ml−1 TGF-β and were analysed by RT–PCR and western blotting, respectively. Data are representative of three technical repeats with mean±s.d. (two-tailed Student’s t-test, **P<0.005, ***P<0.0005). (d,e) MDA-MB-231 and MDA-MB-1386 cells were left non-transfected (−) or transfected (+) with siRNA (20 nM) against mutant p53, and then stimulated with TGF-β and analysed by quantitative RT–PCR. Data are representative of three technical repeats with mean±s.d. (two-tailed Student’s t-test, **P<0.005, ***P<0.0005). (f) H1299 cells were infected either with an E.V, p53 or p53-R175H encoding vectors, and left untreated or treated with 5 ng ml−1 TGF-β for 24 h (upper panel). UMSSC-1 cells stably expressing an empty vector, p53 or p53-R175H vectors were treated similar to those in the upper panel (lower panel). ChIP analysis was performed with antibodies recognizing Smad3. (g) MDA-MB-231 cells expressing endogenous mutant p53 and (h) H1299 cells stably expressing p53-R175H were incubated in the presence or absence of 5 ng ml−1 TGF-β for 24 h and ChIP analyses were performed. (i) H1299 cells were transfected with Smad3/4, p53 or p53-R175H expression plasmids alone or in combination of (Smad3/4 and p53) and (Smad3/4 and p53-R175H), and then stimulated with 5 ng ml−1 TGF-β for 24 h. Nuclear extracts were prepared and subjected to EMSA analysis with 32P-end-labelled probes corresponding to cognate SBE box from the REGγ promoter. *Blocking of Smad3/4 complex formation by mutant p53-R175H. (j,k) Mutant p53 reverts TGF-β induced repression of the REGγ gene through p300. (j) H1299 cells expressing either E.V or p53-R175H, and (k) MDA-MB-231 cells were stimulated with 5 ng ml−1 TGF-β for indicated time points, and subjected to ChIP analysis with indicated antibodies.
Figure 6
Figure 6. Regulation of proteasome pathway by p53/TGF-β via REGγ in cancer cells.
(a) p53 suppresses 20S proteasome activity via REGγ. A549 cells were treated with ETO (10 μM) for 24 h and were analysed for trypsin-like activity of 20S proteasome. Data are representative of three biological repeats with mean±s.d. (two-tailed Student’s t-test, *P<0.05). (b) p53−/− cells shows higher 20S proteasome activity. HCT116p53+/+ and HCT116p53−/− were compared for analysis of 20S activity. Data are representative of three biological repeats with mean±s.d. (two-tailed Student’s t-test, ***P<0.0005). (c) TGF-β inhibits 20S proteasome pathway via REGγ. A549 cells were treated with 5 ng ml−1 TGF-β for 24 h and trypsin-like activity of 20S proteasome was determined. Data are representative of three biological repeats with mean±s.d. (two-tailed Student’s t-test, *P<0.05). (d) Mutant p53 enhances 20S proteasome pathway via REGγ. H1299 cells stably expressing empty vector (E.V) and p53-R175H were compared for trypsin-like activity of 20S proteasome. Data are representative of three biological repeats with mean±s.d. (two-tailed Student’s t-test, ***P<0.0005). (e) Knockdown of REGγ decrease 20S proteasome activity in ARO colon cancer cell lines. Comparison of proteasome activity in control (ARO.SHN) and (ARO.SHR) REGγ-depleted cell lines. Error bars show the mean±s.d. from three technical replicates (two-tailed Student’s t-test, **P<0.005). (f) Attenuation of TGF-β inhibited proteasome activity by mutant p53. H1299 cells stably expressing E.V and mutant p53-R175H were left untreated or treated with 5 ng ml−1 TGF-β for 24 h and then analysed by proteasome assay. Error bars show the mean±s.d. from three technical replicates (two-tailed Student’s t-test, *P<0.05, **P<0.005). (g) Depletion of N-CoR enhances the proteasome pathway. A549 control and knockdown cell lines were transfected with control siRNA or siRNA targeting N-CoR for 72 h and then analysed for proteasome activity. Error bars show the mean±s.d. from three technical replicates (two-tailed Student’s t-test, **P<0.005).
Figure 7
Figure 7. REGγ affects p53 and TGF-β signalling cellular response in cancer cells.
(a) Knockdown of REGγ decrease drug resistance in A549 lung cancer cells. A549 cells were treated with ETO for indicated time points and then analysed by MTT assay. Error bars show the mean±s.d. from three technical replicates (two-tailed Student’s t-test, *P<0.05, **P<0.005). (b) Quantitative comparison for apoptotic level from three independent western blotting experiments. Data show the mean±s.d. from three technical replicates. (c) Knockdown of REGγ restores the tumour suppressor ability of TGF-β. A549 cells were treated with 5 ng ml−1 TGF-β at indicated time points, and then MTT assay were performed to check the cell proliferation. Data show the mean±s.d. from three technical replicates (two-tailed Student’s t-test, *P<0.05, ***P<0.0005). (d) Overexpression of REGγ enhances cell cycle progression in A459 cells. Flag-REGγ expression plasmid was transfected into A549 parental cells for 24 h, and then left untreated or treated with ETO (10 μmol) for 24 h and analysed by fluorescence-activated cell sorting (FACS) analysis. Data show the mean±s.d. from three technical replicates (two-tailed Student’s t-test, **P<0.005 and *P<0.05). (e) Flag-REGγ expression plasmid was transfected into A549 parental cells for 24 h and then left untreated or treated with TGF-β 5 ng ml−1 for 24 h. Cells were collected and analysed by FACS analysis. Error bars show the mean±s.d. from three technical replicates (two-tailed Student’s t-test, **P<0.005 and *P<0.05). (f,g) Manipulation of REGγ and p53 protein levels mutually affects both protein expressions in cancer cells. (f) A549 SHN and SHR cells were left untreated or treated with ETO (10 μmol l−1) for 24 h and were analysed by western blotting. (g) A549 cells were transfected with flag-REGγ for 24 h and then left untreated or treated with ETO (10 μmol l−1) for 24 h, and were analysed by western blotting.
Figure 8
Figure 8. Depletion of REGγ inhibits proliferation and cell cycle transition in cancer cells.
(a) Isogenic HCT116p53+/+ and HCT116p53−/− cells lines, either expressing REGγ (SHN) or REGγ depleted (SHR) were cultured in 96-well plates for indicated days and were analysed by MTT assay. Error bars show the mean±s.d. from three technical replicates (two-way analysis of variance (ANOVA), ***P<0.0005, **P<0.005). (b) MTT assay; cell proliferation ability was inhibited in ARO REGγ-depleted cells (ARO.SHR). Error bars show the mean±s.d. from three technical replicates (two-way ANOVA, ***P<0.0005). (c) MTT assay; cell proliferation ability was inhibited in A549 REGγ-depleted cells (A549.SHR). Data are representative of three technical repeats with mean±s.d. (two-way ANOVA, ***P<0.0005). (d) MDA-MB-231 cells were transfected with siREGγ (20 nM) and si-mutant p53, either independently or in combination for 72 h, and analysed by MTT assay. Error bars show the mean±s.d. from three technical replicates (two-tailed Student’s t-test, ***P<0.0005, **P<0.005). (e) Overexpression of REGγ induces cell cycle transition. Flag-REGγ was transfected into A459 cells for 24 h and then analysed by fluorescence-activated cell sorting (FACS) analysis. Data are representative of three biological replicates with mean±s.d. (two-tailed Student’s t-test, *P<0.05, **P<0.005). (fh) FACS analysis; cell cycle progression was inhibited in (f) A549.SHR-, (g) MDA-MB-231 siREGγ- and (h) AR0.SHR-depleted cells but not in control cell lines. Data are representative of three biological repeats with mean±s.d. (two-tailed Student’s t-test, *P<0.05, **P<0.005).
Figure 9
Figure 9. REGγ shows a positive correlation with mutant p53 in multiple cancer tissues and cell lines.
(a) Western blot analyses of cellular REGγ protein levels in p53- and mutant p53-expressing cancer cells, which is correlated with the p53 status (left panel). Smad4-null cancer cells show more REGγ protein levels in comparison with Smad4-containing cells (right panel). (b) Quantitative RT–PCR analyses of cellular REGγ mRNA levels in four different groups of cancer cells, which are correlated with the p53 status. Error bars show the mean±s.d. from three technical replicates (two-tailed Student’s t-test, *P<0.05, **P<0.005). (c) Total RNA was extracted from each of the four different cancer cell lines containing Smad4-null and Smad4-expressing cells. RT–PCR analyses were performed to measure the REGγ mRNA levels. Error bars show the mean±s.d. from three technical replicates (two-tailed Student’s t-test, *P<0.05, **P<0.005). (d) Mutant p53 positively correlates with the REGγ. IHC analysis of the multiple cancer tissues, which express different groups of mutant p53 proteins, displayed positive correlation with the REGγ overexpression. Scale bars, 50 μm (shown on × 40 images). (e) Statistical analysis of REGγ and mutant p53-positive cancer tissues. (f) Scatter plot for REGγ and mut-p53 correlation in the same sets of tumours. The scores were put into the plot using the Bland–Altman plot standard method. (g) Bioinformatics analysis of lung and colon cancers, in which overexpression of REGγ negatively correlated with the p53 pathway and TGF-β receptors expression. Pearson’s correlation coefficient was used as a measure of correlation between REGγ and its potentially related genes. Pearson’s correlation analysis was conducted using ‘R programme’ on data set with significant overexpression of REGγ.
Figure 10
Figure 10. Differential regulation of the REGγ–20S proteasome pathway by p53/Smad3 and mutant p53 in cancer cells.
A hypothetic model that illustrates (a) both TGF-β and p53 signalling suppress the ubiquitin/ATP-independent REGγ–20Sproteasome pathway via REGγ. Smad3 and p53 proteins negatively regulate REGγ expression through recruitment of its co-repressors. The net output of this mechanism is to prevent the degradation of tumour suppressor proteins and, subsequently, inhibit cancer progression, cell proliferation and decrease drug resistance in cancer cells. (b) Novel GOF of mutant p53: mutant p53 exerts bipartite mechanism to enhance the REGγ–20S proteasome pathway in cancer cells. On one side, mutant p53 binds and recruits p300, a coactivator, and on another side block the recruitment of the Smad3/N-CoR complex formation on REGγ promoter in response to TGF-β. The net gain of this mechanism is to enhance the REGγ–20S proteasome pathway via REGγ in cancer cells to accelerate cancer progression, promote cell proliferation and increase drug resistance during tumour development.

References

    1. Ma C. P., Slaughter C. A. & DeMartino G. N. Identification, purification, and characterization of a protein activator (PA28) of the 20 S proteasome (macropain). J. Biol. Chem. 267, 10515–10523 (1992). - PubMed
    1. Dubiel W., Pratt G., Ferrell K. & Rechsteiner M. Purification of an 11 S regulator of the multicatalytic protease. J. Biol. Chem. 267, 22369–22377 (1992). - PubMed
    1. Li X. et al.. The SRC-3/AIB1 coactivator is degraded in a ubiquitin- and ATP-independent manner by the REGgamma proteasome. Cell 124, 381–392 (2006). - PubMed
    1. Chen X., Barton L. F., Chi Y., Clurman B. E. & Roberts J. M. Ubiquitin-independent degradation of cell-cycle inhibitors by the REGgamma proteasome. Mol. Cell 26, 843–852 (2007). - PMC - PubMed
    1. Li X. et al.. Ubiquitin- and ATP-independent proteolytic turnover of p21 by the REGgamma-proteasome pathway. Mol. Cell 26, 831–842 (2007). - PubMed

Publication types

MeSH terms