. 2013:4:2672.
doi: 10.1038/ncomms3672.

Semiconductor-based DNA sequencing of histone modification states

Affiliations

Semiconductor-based DNA sequencing of histone modification states

Christine S Cheng et al. Nat Commun. 2013.

Abstract

The recent development of a semiconductor-based, non-optical DNA sequencing technology promises scalable, low-cost and rapid sequence data production. The technology has previously been applied mainly to genomic sequencing and targeted re-sequencing. Here we demonstrate the utility of Ion Torrent semiconductor-based sequencing for sensitive, efficient and rapid chromatin immunoprecipitation followed by sequencing (ChIP-seq) through the application of sample preparation methods that are optimized for ChIP-seq on the Ion Torrent platform. We leverage this method for epigenetic profiling of tumour tissues.


Conflict of interest statement

Statement of Competing Financial Interests

The authors declare no competing financial interests.

Figures
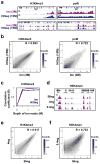
Figure 1
Figure 1. Ion Torrent and Illumina HiSeq ChIP-seq
(a) Density profiles of H3K4me3 (left) and polII ChIP-seq (right) from 2 million Ion Torrent reads (purple) and 15 million Illumina HiSeq reads (blue) over the Mx1 gene locus (top) and a larger region spanning the TNF locus (bottom). The scale of the density profile was set to the same level for each pair of samples, and is marked. All ChIP-seq experiments were performed with mDCs stimulated with LPS (0.1 ug/ml) for 2 hours. (b) A comparison of H3K4me3 (left) and polII (right) ChIP-seq peak enrichment scores (log2) over a 500bp sliding window from 2 million Ion Torrent reads (X axis) and 15 million Illumina HiSeq reads (Y axis). The Pearson correlation coefficient is marked at the upper right corner. The grayscale represents a two-dimensional density plot, where the grid is divided into hexagonal bins and the color intensity reflects the density (counts) in the bin. An intensity bar of the counts is shown at the right bottom corner. (c) Saturation analysis to test for sufficient sequencing depth. Shown is the Pearson correlation coefficient (Y axis) calculated between decreasing sequencing reads randomly sub-sampled from the H3K4me3 ChIP-seq Ion Torrent reads (X axis) and either 15 million H3K4me3 ChIP-seq Illumina HiSeq reads (blue) or 2 million Ion Torrent reads (purple). (d) Density profiles of H3K4me3 ChIP-seq from 2 million Ion Torrent reads for libraries with 56ng, 4ng or 0.4ng of immunoprecipitated input DNA. (e, f) A comparison of H3K4me3 ChIP-seq peak enrichment scores (log2) over a 500bp window from 2 million Ion Torrent reads with 56ng (Y axis) and 4ng (d, X axis) or 0.4ng (e, X axis) of immunoprecipitated input DNA. The Pearson correlation coefficient is marked at the upper right corner. The grayscale representation as in panel (b).
Figure 2
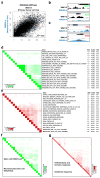
Figure 2. Epigenetic signatures correspond to cancer progression
(a) A comparison of accumulated H3K4me3 profiles in a pair of matching metastasis and primary tumor cell lines. Shown are the number of ChIP-seq reads over 1kb upstream and 1kb downstream of transcription start site of each of 20,000 human genes in a matched pair of primary melanoma tumor (WM115, black, X axis) and metastasis (WM266-4, blue, Y axis) cell lines derived from the same patient. The Pearson correlation coefficient is in the bottom right corner. (b, c) Density profiles of normalized reads from H3K4me3 ChIP-seq of primary melanoma tumor derived cell line (WM115) or metastasis derived cell line (WM266-4), at illustrative loci with either lower (b) or higher (c) levels of H3K4me3 in the metastasis derived cell line. (d–g) Gene sets enriched (by GSEA) among loci with different levels of histone modifications. In each case, shown are the names of the enriched gene sets (rows) along with the normalized enrichment score (NES), enrichment p value (P value) and False discovery rates (FDR). Each entry in the heat map indicates the percent overlap in ‘leading edge genes’ (those that contribute to the enrichment) between two enriched gene sets. (d) Genes with lower H3K4me3 in metastasis cell line (WM266-4) relative to control primary tumor cell line (WM115). (e) Genes with higher H3K4me3 in metastasis cell line (WM266-4) relative to control primary tumor (WM115). (f) Genes with lower H3K4me3 in metastatic melanoma tumors from patients (an average of seven tumors samples) relative to control normal skin melanocytes (an average of three biological samples). (g) Genes with higher H3K4me3 in metastatic melanoma tumors from patients relative to control normal skin melanocytes.

References

    1. Rothberg JM, et al. An integrated semiconductor device enabling non-optical genome sequencing. Nature. 2011;475:348–52. - PubMed
    1. Ferain I, Colinge CA, Colinge JP. Multigate transistors as the future of classical metal-oxide-semiconductor field-effect transistors. Nature. 2011;479:310–6. - PubMed
    1. Glenn TC. Field guide to next-generation DNA sequencers. Mol Ecol Resour. 2011;11:759–69. - PubMed
    1. Merriman B, Rothberg JM. Progress in ion torrent semiconductor chip based sequencing. Electrophoresis. 2012;33:3397–417. - PubMed
    1. Vogel U, et al. Ion torrent personal genome machine sequencing for genomic typing of Neisseria meningitidis for rapid determination of multiple layers of typing information. Journal of clinical microbiology. 2012;50:1889–94. - PMC - PubMed

Publication types

MeSH terms

Associated data