. 2014 Mar-Apr;21(2):353-62.
doi: 10.1136/amiajnl-2013-001612. Epub 2013 Oct 24.

Mining clinical text for signals of adverse drug-drug interactions

Affiliations

Mining clinical text for signals of adverse drug-drug interactions

Srinivasan V Iyer et al. J Am Med Inform Assoc. 2014 Mar-Apr.

Abstract

Background and objective: Electronic health records (EHRs) are increasingly being used to complement the FDA Adverse Event Reporting System (FAERS) and to enable active pharmacovigilance. Over 30% of all adverse drug reactions are caused by drug-drug interactions (DDIs) and result in significant morbidity every year, making their early identification vital. We present an approach for identifying DDI signals directly from the textual portion of EHRs.

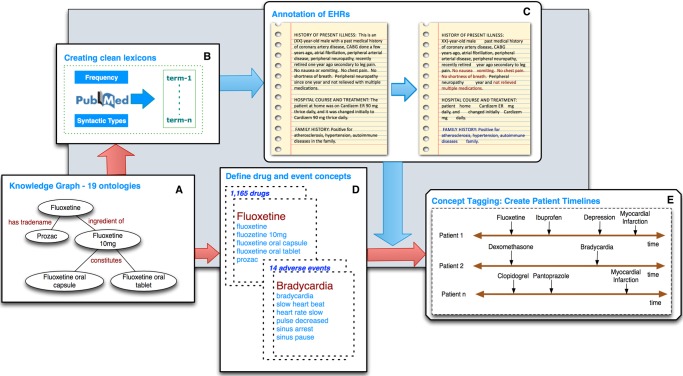
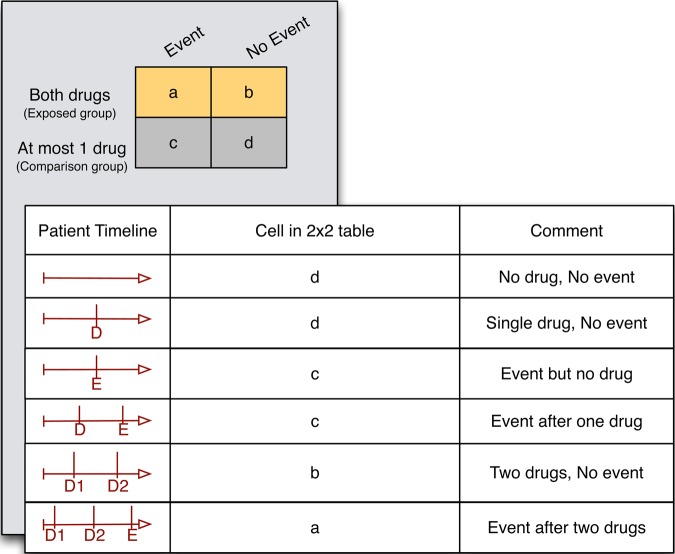
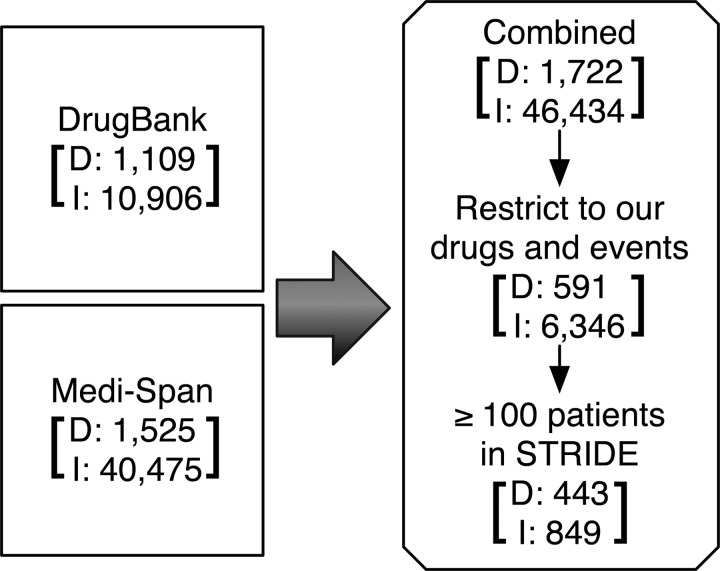
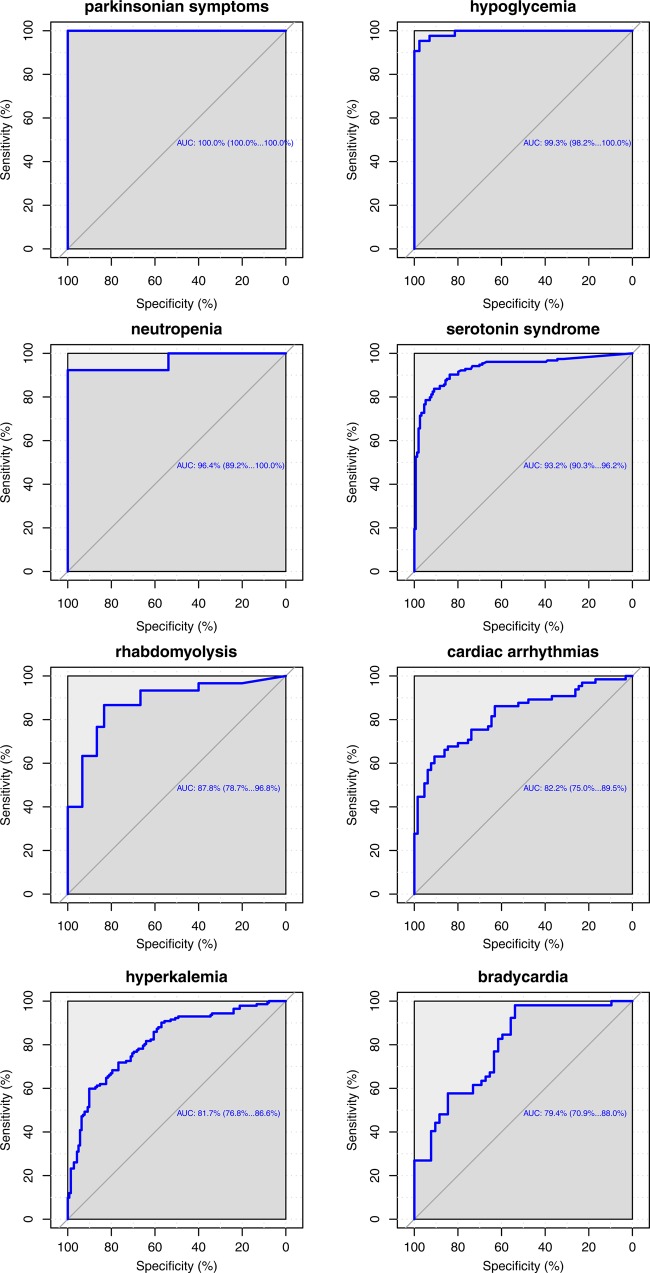
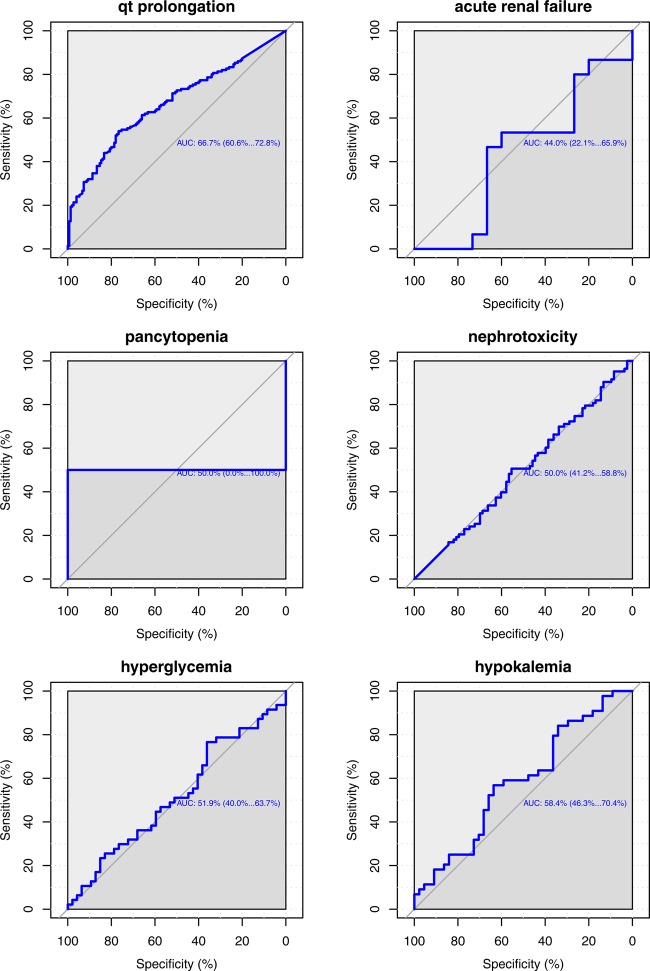
Methods: We recognize mentions of drug and event concepts from over 50 million clinical notes from two sites to create a timeline of concept mentions for each patient. We then use adjusted disproportionality ratios to identify significant drug-drug-event associations among 1165 drugs and 14 adverse events. To validate our results, we evaluate our performance on a gold standard of 1698 DDIs curated from existing knowledge bases, as well as with signaling DDI associations directly from FAERS using established methods.

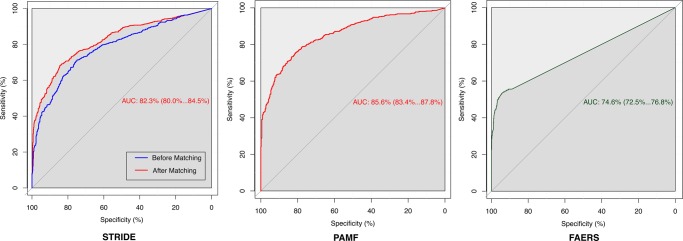
Results: Our method achieves good performance, as measured by our gold standard (area under the receiver operator characteristic (ROC) curve >80%), on two independent EHR datasets and the performance is comparable to that of signaling DDIs from FAERS. We demonstrate the utility of our method for early detection of DDIs and for identifying alternatives for risky drug combinations. Finally, we publish a first of its kind database of population event rates among patients on drug combinations based on an EHR corpus.

Conclusions: It is feasible to identify DDI signals and estimate the rate of adverse events among patients on drug combinations, directly from clinical text; this could have utility in prioritizing drug interaction surveillance as well as in clinical decision support.

Keywords: Adverse Reactions; Data Mining; Drug Interaction; Electronic Health Records; Ontology; Pharmacovigilance.


Figures

Figure 1
Figure 1
The annotator workflow. (A) The annotator uses a lexicon of approximately 5.6M terms derived from the Unified Medical Language System (UMLS) and BioPortal, as well as trigger terms for NegEx and ConText. (B) It uses term frequency and syntactic type information from Medline to prune the set of strings into a clean lexicon. (C) It then uses the lexicon for exact string matching on the textual notes, followed by negation detection (red) and family history detection (blue). The output is a list of positively mentioned terms recognized in the text. (D) UMLS and BioPortal terms are used to define concepts (a set of terms), making use of the relationships in the ontologies to expand the set. (E) Each note is tagged with a concept if any one of the defining terms appears in the note as a positive mention. The concepts are ordered by the note's timestamp, creating a concept timeline for each patient.
Figure 2
Figure 2
Assignment of patients to various cells of the 2×2 contingency table. The portion of the timeline after the first occurrence of the event is ignored. D, drug; E, event.
Figure 3
Figure 3
Preparation of Gold standard. We use known interactions from DrugBank and Medi-Span having at least 100 patients on the drug combination in the Stanford Translational Research Integrated Database Environment (STRIDE) as the true positives in our gold standard. The number of drugs (D) and interactions (I) at each stage are specified.
Figure 4
Figure 4
Performance on the Stanford Translational Research Integrated Database Environment (STRIDE), Palo Alto Medical Foundation (PAMF), and FDA Adverse Event Reporting System (FAERS) datasets as evaluated by the gold standard: receiver operator characteristic curves showing sensitivity and specificity levels that can be achieved by varying the threshold. Performance improves after propensity score based matching (red curve in STRIDE and PAMF). For STRIDE, we use our gold standard of 1320 interactions on 10 adverse events. 1132 out of 1320 interactions have enough support for signaling from PAMF. FAERS uses all 1320 test cases, and test cases without enough reports in FAERS were given a score of 0.
Figure 5
Figure 5
Event-wise performance in the Stanford Translational Research Integrated Database Environment (STRIDE): receiver operator characteristic (ROC) curves showing sensitivity and specificity values for various thresholds on the gold standard test cases using STRIDE. Using such curves, event specific thresholds can be chosen. Hyperkalemia, acute renal failure, nephrotoxicity, and hyperglycemia did not perform well. This could be due to our inability to accurately tag notes with these concepts, or due to the gold standard itself (see Discussion). The area under the ROC curve for pancytopenia has a very large variance due to an insufficient number of tested interactions.
Figure 5
Figure 5
Event-wise performance in the Stanford Translational Research Integrated Database Environment (STRIDE): receiver operator characteristic (ROC) curves showing sensitivity and specificity values for various thresholds on the gold standard test cases using STRIDE. Using such curves, event specific thresholds can be chosen. Hyperkalemia, acute renal failure, nephrotoxicity, and hyperglycemia did not perform well. This could be due to our inability to accurately tag notes with these concepts, or due to the gold standard itself (see Discussion). The area under the ROC curve for pancytopenia has a very large variance due to an insufficient number of tested interactions.

References

    1. Lazarou J, Pomeranz BH, Corey PN. Incidence of adverse drug reactions in hospitalized patients: a meta-analysis of prospective studies. JAMA 1998;279:1200–5 - PubMed
    1. Johnson JA, Bootman JL. Drug-related morbidity and mortality. A cost-of-illness model. Arch Intern Med 1995;155:1949–56 - PubMed
    1. Bushardt RL, Massey EB, Simpson TW, et al. Polypharmacy: misleading, but manageable. Clin Interv Aging 2008;3:383–9 - PMC - PubMed
    1. Strandell J, Bate A, Lindquist M, et al. Drug-drug interactions—a preventable patient safety issue? Br J Clin Pharmacol 2008;65:144–6 - PMC - PubMed
    1. Pirohamed M. Drug interactions of clinical importance. London: Chapman and Hall, 1998

Publication types