Review
. 2014:7:115-25.
doi: 10.1109/RBME.2013.2286296. Epub 2013 Oct 23.

A century of optocardiography

Review

A century of optocardiography

Bas J Boukens et al. IEEE Rev Biomed Eng. 2014.

Abstract

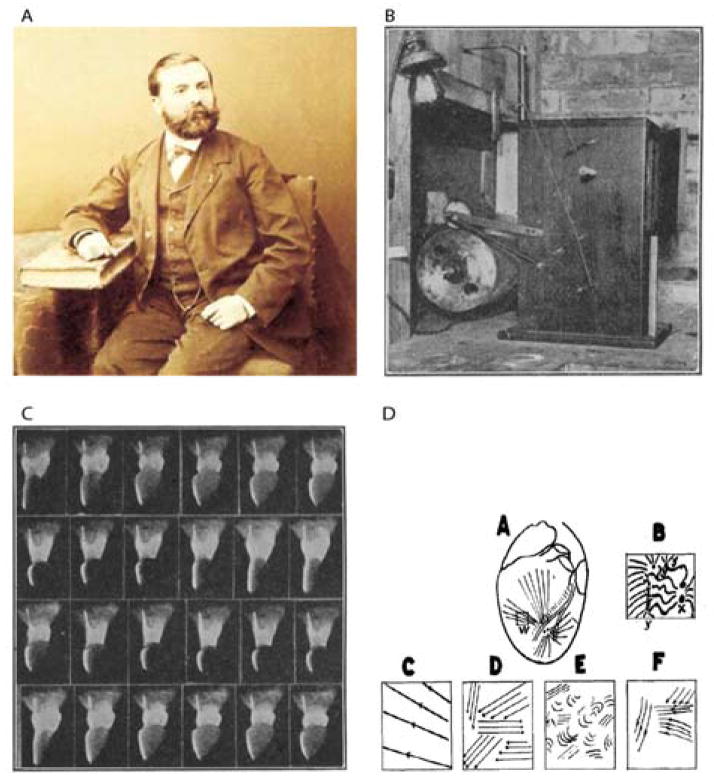
In the past decade, optical mapping provided crucial mechanistic insight into electromechanical function and the mechanism of ventricular fibrillation. Therefore, to date, optical mapping dominates experimental cardiac electrophysiology. The first cardiac measurements involving optics were done in the early 1900s using the fast cinematograph that later evolved into methods for high-resolution activation and repolarization mapping and stimulation of specific cardiac cell types. The field of "optocardiography," therefore, emerged as the use of light for recording or interfering with cardiac physiology. In this review, we discuss how optocardiography developed into the dominant research technique in experimental cardiology. Furthermore, we envision how optocardiographic methods can be used in clinical cardiology.


Figures

Figure 1
Figure 1
Early history of optocardiography stared from work of Marey (A) whose cinematographic gun was used by Mines (B) to record contractions of a frog heart (C). Wiggers used fast film cinematography to analyze different phases of ventricular fibrillation (D).
Figure 2
Figure 2
Optical recording of cardiac action potentials using fluorescent dyes. A. The upper panel illustrates the conformation change of di-4-ANEPPS upon a change in membrane potentials. The lower panel shows the shift in emission spectrum results in a change in the amount of recorded fluorescence. B. The upper panel, Simultaneous fluorescent (Vf) and microelectrode (Ve) recordings of action potentials in the frog heart stained with Merocyanine-540. The lower panel, Optical recording of action potentials from different regions of the heart stained with di-4-ANEPPS: ventricular and atrial working myocardium, AV node, and Crista terminalis. Modified from Efimov [5].
Figure 3
Figure 3
Optical mapping of AVJ #6 during atrial pacing. Panel A: OAPs recorded from sites 1–5 in panels B, during atrial pacing at 60 bpm (CL=1000ms). Red dots on OAP upstrokes correspond to dV/dt peaks. Panel B: Separated atrial, AV nodal, and His bundle activation maps superimposed on the OFV (30×30 mm2). The black line demarcates the TA. Modified from Fedorov et al [143].
Figure 4
Figure 4
Optical imaging of shock-induced arrhythmogenesis and defibrillation. A, Preparation. B, Shock-induced polarization. C, Shock-induced conduction pattern. D, Optical recording of transmembrane potential during normal action potential, T-wave shock, and shock-induced arrhythmia. Modified from [32].
Figure 5
Figure 5
Reconstructed heart surface and epicardial action potential texture mapping. (A) Left: reconstructed heart surface visualized from projections of PDA arrays. Middle: epicardial action potential texture mapping during epicardial pacing (p in PDA-2 projection is the pacing site). Right: epicardial action potential texture mapping during shock-induced ventricular tachycardia. Modified from Qu et al [144].
Figure 6
Figure 6
Left ventricular wedge preparation and optical recordings of action potentials (AP) and calcium transients (CaT). (A) An explanted nonfailing human heart. The region indicated by white rectangle was dissected and cannulated for wedge preparation. (B) The left ventricular wedge preparation from the same heart. (C) Pseudo-ECG (p-ECG) and representative optical recordings of AP and CaT from locations within sub-endocardium (sub-ENDO), midmyocardium (MID), and sub-epicardium (sub-EPI), which are indicated by the black stars shown in the panel B. (D) Terminology. Left: superimposed AP and CaT with illustrations of AP duration at 80% repolarization (APD80), CaT duration at 30% and 80% recovery (CaTD30 and CaTD80). Right: Close-up view of upstrokes (thin lines), and the derivatives (thick lines, labeled as dF/dt) with illustrations of AP-CaT delay and 10%–90% rise time of CaT. Modified from Lou et al [144].
Figure 7
Figure 7
A: schematic diagram of the optical system. LED, light-emitting diode; DM1 and DM2, first and second dichroic mirrors, respectively; EmF1, emission filter; PDA1 and PDA2, first and second photodiode arrays, respectively. B: cross-sectional and side views of the of the optrode tissue end. C: Intramural membrane voltage (Vm) and intracellular Ca2+ (Cai2+) measured during regular rhythm. A: raw traces of Vm (blue) and Cai2+ (red) from five optrodes. The inset in the bottom right corner schematically shows the optrode insertion sites. PM, papillary muscle; Epi, epicardium. Modified with permission from Kong et al. [121].

Similar articles

Cited by

References

    1. Waller AD. A Demonstration on Man of Electromotive Changes accompanying the Heart’s Beat. J Physiol. 1887 Oct;8:229–34. - PMC - PubMed
    1. Koelliker RAMH. Nachweis der negativen Schwankung des Muskelstroms am naturlich sich contrahirenden Muskel. Verhandlungen der Physikalisch-medizinische Gesellschaft in Würzburg. 1856;6:15.
    1. Oster HS, Taccardi B, Lux RL, Ershler PR, Rudy Y. Noninvasive electrocardiographic imaging: reconstruction of epicardial potentials, electrograms, and isochrones and localization of single and multiple electrocardiac events. Circulation. 1997 Aug 5;96:1012–24. - PubMed
    1. Lewalter TLB. Historical Milestones of Electrical Signal Recording and Analysis. In: Gussak IAC, editor. Briding Basic and Clinical Science. New Jersey: Humana Press Inc; 2010. pp. 7–21.
    1. Efimov IR, Nikolski VP, Salama G. Optical imaging of the heart. Circulation Research. 2004;95:21–33. - PubMed

Publication types