. 2014 Jan;25(1):105-18.
doi: 10.1681/ASN.2013020161. Epub 2013 Oct 24.

A bioinformatics approach identifies signal transducer and activator of transcription-3 and checkpoint kinase 1 as upstream regulators of kidney injury molecule-1 after kidney injury

Affiliations

A bioinformatics approach identifies signal transducer and activator of transcription-3 and checkpoint kinase 1 as upstream regulators of kidney injury molecule-1 after kidney injury

Amrendra Kumar Ajay et al. J Am Soc Nephrol. 2014 Jan.

Abstract

Kidney injury molecule-1 (KIM-1)/T cell Ig and mucin domain-containing protein-1 (TIM-1) is upregulated more than other proteins after AKI, and it is highly expressed in renal damage of various etiologies. In this capacity, KIM-1/TIM-1 acts as a phosphatidylserine receptor on the surface of injured proximal tubular epithelial cells, mediating phagocytosis of apoptotic cells, and it may also act as a costimulatory molecule for immune cells. Despite recognition of KIM-1 as an important therapeutic target for kidney disease, the regulators of KIM-1 transcription in the kidney remain unknown. Using a bioinformatics approach, we identified upstream regulators of KIM-1 after AKI. In response to tubular injury in rat and human kidneys or oxidant stress in human proximal tubular epithelial cells (HPTECs), KIM-1 expression increased significantly in a manner that corresponded temporally and regionally with increased phosphorylation of checkpoint kinase 1 (Chk1) and STAT3. Both ischemic and oxidant stress resulted in a dramatic increase in reactive oxygen species that phosphorylated and activated Chk1, which subsequently bound to STAT3, phosphorylating it at S727. Furthermore, STAT3 bound to the KIM-1 promoter after ischemic and oxidant stress, and pharmacological or genetic induction of STAT3 in HPTECs increased KIM-1 mRNA and protein levels. Conversely, inhibition of STAT3 using siRNAs or dominant negative mutants reduced KIM-1 expression in a kidney cancer cell line (769-P) that expresses high basal levels of KIM-1. These observations highlight Chk1 and STAT3 as critical upstream regulators of KIM-1 expression after AKI and may suggest novel approaches for therapeutic intervention.


Figures

Figure 1.
Figure 1.
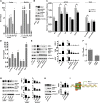
Bioinformatics approach identifies STAT3 and Chk1 as molecular regulators of KIM-1 expression after IRI. (A) Left heat map panel shows genes with highly variable expression (n=1571) across various time points after 20 minutes of bilateral IRI (red and blue indicate relative up- and downregulation, respectively). Hierarchical clustering was performed by using 1−Pearson correlation as distance with average linkage. According to the hierarchical clustering, we selected 220 probes showing substantial upregulation in early time points (6 and 24 hours after IRI) both in renal cortex and medulla (right heat map panel). (B) Six transcription factors with expression that is available in our dataset are shown across different time points after IRI (solid and dashed lines are cortex and medulla, respectively). (C) The IRI genes associated with each of three transcription factors (MYC, KLF4, and STAT3) that showed upregulation after IRI are shown as network presentation. The IRI genes with single connection with each of the three transcription factors are shown in outer layer. KIM-1 (yellow) is identified as a target of STAT3 using ARACNe. (D) Potential transcription factor binding sites on KIM-1 promoter sequence. (E) Five transcription factors (E2F transcription factor 4 [E2F4], STAT3, MYC, V-myb avian myeloblastosis viral oncogene homolog [MYB], and KLF4; red nodes) are shown with their interacting genes as visualized by Genes2Networks. The transcription factors without interacting gene partners are ignored in this analysis. (F) Top 10 kinases are shown for their significance (−log10P) of enrichment (i.e., the overlap between the known targets of the kinase and genes identified in Genes2Networks). (G) Based on literature and our bioinformatics predictions, the schematic diagram represents our hypothesis that IRI generates ROS, thereby initiating DNA damage signaling response in the kidney. Chk1 is activated, and it binds and phosphorylates STAT3, which in turn, translocates to the nucleus and binds to KIM-1 promoter, resulting in its transcription.
Figure 2.
Figure 2.
IRI in the kidney activates Chk1 as a result of DNA damage. After 30 minutes IRI in rats, kidney tissue lysates were prepared, and (A) ROS estimation was plotted as DCFDA converted to DCF. (B) Immunoblotting and respective quantitation analysis of pATR, pChk1 and pH2A.X. α-Tubulin served as loading control. (C) pH2A.X immunostaining (green) in kidney sections (left panels). Scale bar: 10 µm. The number of pH2A.X foci per nuclei was plotted (right panels). (D) DNA damage by terminal deoxynucleotidyl transferase-mediated digoxigenin-deoxyuridine nick-end labeling (TUNEL) assay (green) in kidney sections (left panel). Scale bar: 10 µm. Percentage of TUNEL-positive nuclei were plotted (right panel). HPTECs were treated with HU and (E) incubated with DCFDA for 1 hour. Cells were imaged immediately. Scale bar: 10 µm. Mean fluorescence intensity (MFI) was plotted for Ctrl and HU-treated cells. (F) Immunoblotting was performed for pATR, pH2A.X, pChk1, and Chk1. GAPDH served as loading control. (G) DNA damage determined by TUNEL assay (green). Scale bar: 10 µm. Percentage of TUNEL-positive nuclei was counted and plotted. (H) Immunoblotting and quantitative analysis for pChk1 and Chk1 were performed in HPTECs treated with ROS inhibitor YCG063 alone or combined with HU. (I) Schematic diagram summarizing the results in this figure. ROS generation caused by IRI or oxidant stress (HU treatment) in the proximal tubular epithelial cells of kidney mediates DNA damage signaling response, causing phosphorylation of ATR and Chk1. *Significance compared with sham or controls (P<0.05). $Significance compared with treatment (P<0.05).
Figure 3.
Figure 3.
Chk1 binds to STAT3 and activates it after kidney injury. HPTECs were pretreated with (A) 1 μM Chk1 inhibitor (SB218078) and/or HU, and its effect on expression of pChk1, Chk1, pJAK2, JAK2, pSTAT3 Y705, pSTAT3 S727, STAT3, and KIM-1 was assessed using immunoblotting and quantitative analysis. (B) HU and/or Ctrl or Chk1 siRNA and its effect on expression of pChk1, Chk1, pSTAT3 Y705, pSTAT3 S727, STAT3, and KIM-1 were assessed using immunoblotting and quantitative analysis. (C) HPTECs were treated with HU and/or JAK2 inhibitor (AG490), and its effect on expression of pJAK2, JAK2, pSTAT3 Y705, pSTAT3 S727, STAT3, and KIM-1 was assessed using immunoblotting followed by quantitative analysis. GAPDH served as loading control. (D) HPTECs were treated with HU alone or combined with SB218078, and immunoprecipitation by Chk1 antibody was performed followed by immunoblotting for pSTAT3 Y705, pSTAT3 S727, or STAT3. GAPDH and IgG light chain served as loading controls for input and IP, respectively. (E) Immunofluorescence was performed to evaluate expression of pSTAT3 S727 and pChk1 in HPTECs. Images were obtained at 63× objective using an immunofluorescent microscope. Scale bar: 10 µm. (F) Schematic diagram advancing the hypothesis and summarizing the results in this figure that shows binding of Chk1 and STAT3, resulting in its phosphorylation. *Significance compared with sham or controls (P<0.05). $Significance compared with treatment (P<0.05).
Figure 4.
Figure 4.
Expression of KIM-1 and STAT3 phosphorylation is correlated in rat kidneys after IRI and patients with ATI. After 30 minutes IRI in rat cortex and medulla, (A) RT-PCR was performed for KIM-1 mRNA, and the results were normalized to GAPDH. *Significance compared with sham (P<0.05). (B) Immunoblotting and respective quantitation analysis for expression of pSTAT3 (Y705, S727), STAT3, pJAK2, JAK2, and KIM-1 were performed. β-Actin served as loading control. (C) Human kidney biopsies with or without ATI were costained for pSTAT3 (Y705, S727) and KIM-1 (left panels). Scale bar: 10 µm. Area and tabular chart of percentage pSTAT3 nuclei and percent KIM-1–positive tubule (right panel).
Figure 5.
Figure 5.
STAT3 binds on the KIM-1 promoter and regulates its expression. (A) ChIP assay was performed in kidney tissue for STAT3 binding on the KIM-1 promoter. (B) Immunoblotting for KIM-1, pSTAT3, STAT3, and α-tubulin (loading control) was performed in HPTECs and renal epithelial carcinoma cells (769-P) to evaluate endogenous levels of these proteins. (C) KIM-1 luciferase assay was performed with wild-type or mutant KIM-1 luciferase in HPTECs after transfection with STAT3 plasmid and treatment with IL-6 and dexamethasone or HU. KIM-1 wild-type and mutant luciferase activity was also measured in 769-P cells transfected with STAT3 siRNA. (D) RT-PCR analysis for KIM-1 mRNA was performed in HPTECs treated with IL-6 and dexamethasone and transfected with empty vector (EV) versus STAT3 plasmid or transfected with STAT3_S727A and/or IL-6 and dexamethasone treatment; 769-P cells served as positive control. (E) Immunoblotting and respective quantitation analysis for expression of KIM-1, pSTAT3 (Y705 and S727), and STAT3 were performed in HPTECs treated with IL-6 and dexamethasone. In addition, expression of these proteins was also evaluated in HPTECs transfected with STAT3_Y705F or STAT3_S727A alone or combined with IL-6 and dexamethasone. α-Tubulin served as loading control. (F and G) 769-P cells were transfected with Ctrl siRNA, STAT3 siRNA, EV, or STAT3 mutants (Y705F or S727A), and (F) RT-PCR analysis for KIM-1 mRNA as well as (G) immunoblotting and respective quantitation analysis for KIM-1, pSTAT3 (Y705 and S727), and STAT3 were performed. α-Tubulin served as loading control. (H) HPTECs transfected with EV or STAT3_S727A with HU treatment were immunoblotted and quantitated for KIM-1, pSTAT3 S727, and STAT3. α-Tubulin served as loading control. (I) Schematic summary of STAT3 DNA binding on the KIM-1 promoter. *Significantly different than respective controls (P<0.05). $Significance compared with the same treatment.

References

    1. Ichimura T, Bonventre JV, Bailly V, Wei H, Hession CA, Cate RL, Sanicola M: Kidney injury molecule-1 (KIM-1), a putative epithelial cell adhesion molecule containing a novel immunoglobulin domain, is up-regulated in renal cells after injury. J Biol Chem 273: 4135–4142, 1998 - PubMed
    1. Amin RP, Vickers AE, Sistare F, Thompson KL, Roman RJ, Lawton M, Kramer J, Hamadeh HK, Collins J, Grissom S, Bennett L, Tucker CJ, Wild S, Kind C, Oreffo V, Davis JW, 2nd, Curtiss S, Naciff JM, Cunningham M, Tennant R, Stevens J, Car B, Bertram TA, Afshari CA: Identification of putative gene based markers of renal toxicity. Environ Health Perspect 112: 465–479, 2004 - PMC - PubMed
    1. Vaidya VS, Ozer JS, Dieterle F, Collings FB, Ramirez V, Troth S, Muniappa N, Thudium D, Gerhold D, Holder DJ, Bobadilla NA, Marrer E, Perentes E, Cordier A, Vonderscher J, Maurer G, Goering PL, Sistare FD, Bonventre JV: Kidney injury molecule-1 outperforms traditional biomarkers of kidney injury in preclinical biomarker qualification studies. Nat Biotechnol 28: 478–485, 2010 - PMC - PubMed
    1. Vaidya VS, Ramirez V, Ichimura T, Bobadilla NA, Bonventre JV: Urinary kidney injury molecule-1: A sensitive quantitative biomarker for early detection of kidney tubular injury. Am J Physiol Renal Physiol 290: F517–F529, 2006 - PubMed
    1. Vaidya VS, Waikar SS, Ferguson MA, Collings FB, Sunderland K, Gioules C, Bradwin G, Matsouaka R, Betensky RA, Curhan GC, Bonventre JV: Urinary biomarkers for sensitive and specific detection of acute kidney injury in humans. Clin Transl Sci 1: 200–208, 2008 - PMC - PubMed

Publication types

MeSH terms