. 2014 Jan;25(1):65-80.
doi: 10.1681/ASN.2013010072. Epub 2013 Oct 24.

MicroRNA-214 antagonism protects against renal fibrosis

Affiliations

MicroRNA-214 antagonism protects against renal fibrosis

Laura Denby et al. J Am Soc Nephrol. 2014 Jan.

Abstract

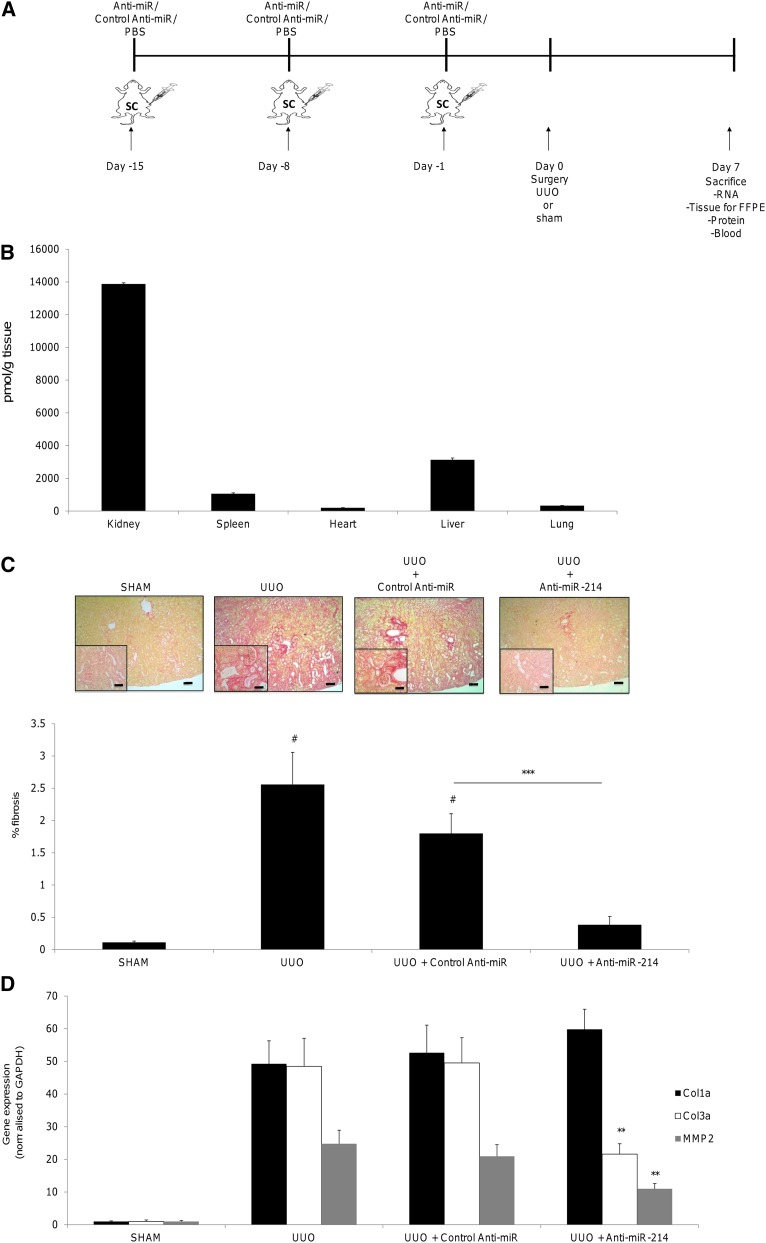
Renal tubulointerstitial fibrosis is the common end point of progressive renal disease. MicroRNA (miR)-214 and miR-21 are upregulated in models of renal injury, but the function of miR-214 in this setting and the effect of its manipulation remain unknown. We assessed the effect of inhibiting miR-214 in an animal model of renal fibrosis. In mice, genetic deletion of miR-214 significantly attenuated interstitial fibrosis induced by unilateral ureteral obstruction (UUO). Treatment of wild-type mice with an anti-miR directed against miR-214 (anti-miR-214) before UUO resulted in similar antifibrotic effects, and in vivo biodistribution studies demonstrated that anti-miR-214 accumulated at the highest levels in the kidney. Notably, in vivo inhibition of canonical TGF-β signaling did not alter the regulation of endogenous miR-214 or miR-21. Whereas miR-21 antagonism blocked Smad 2/3 activation, miR-214 antagonism did not, suggesting that miR-214 induces antifibrotic effects independent of Smad 2/3. Furthermore, TGF-β blockade combined with miR-214 deletion afforded additional renal protection. These phenotypic effects of miR-214 depletion were mediated through broad regulation of the transcriptional response to injury, as evidenced by microarray analysis. In human kidney tissue, miR-214 was detected in cells of the glomerulus and tubules as well as in infiltrating immune cells in diseased tissue. These studies demonstrate that miR-214 functions to promote fibrosis in renal injury independent of TGF-β signaling in vivo and that antagonism of miR-214 may represent a novel antifibrotic treatment in the kidney.


Figures

Figure 1.
Figure 1.
Effect of SB525334 treatment on tubulointerstitial fibrosis in mice. C57bl/6 mice are treated daily with SB525334 from day −1 to 7 days at a dose of 10 mg/kg by oral gavage. UUO or sham surgery is performed on day 0 and animals euthanized at +7 days. (A) FFPE kidney tissue in 3-µM sections. Picrosirius red and Masson’s trichrome staining is performed to assess the level of collagen deposition, and the extent of fibrosis (by Picrosirius red staining) is quantified by Image Pro Plus (n=6 per group, one-way ANOVA with Tukey’s post hoc test is used to analyze data). ###P<0.001 versus UUO + vehicle. (B) Total kidney RNA is extracted (n=6 per group) using a miRNeasy kit (Qiagen). Gene expression is assessed using specific probes (Life Technologies) and normalized to mouse Gapdh. ***P<0.001 versus sham; #P<0.05 versus UUO + vehicle. (C) Protein lysates from snap-frozen kidney tissue are prepared and quantified, and 50 μg is fractionated. Proteins are transferred onto nitrocellulose membranes and probed for p-Smad 2 (1:500), p-Smad 3 (1:500), and GAPDH (1:1000). Densitometry is performed using Quantity One software (n=3 per group). One-way ANOVA with Tukey’s post hoc is used to analyze data. ***P<0.001; *P<0.05 versus sham; #P<0.01 versus UUO + vehicle. (D) Nuclear translocation of p-Smad 2/3 is assessed on 3-µM FFPE sections (n=4 per group). Rabbit polyclonal antibody specific to p-Smad 2/3 is used, with a goat-anti-rabbit Alexa488 as a secondary detection antibody (n=6 fields of view are blind counted per section). Quantification is performed by counting the number of positive nuclei as a percentage of the total nuclei present. One-way ANOVA with Tukey’s post hoc is used to analyze data. ***P<0.001; *P<0.05 versus sham; #P<0.001 versus UUO + vehicle. Scale bar, 100 µM in A; 20 µM in D. GAPDH, glyceraldehyde 3-phosphate dehydrogenase; RQ, relative quantification; MMP, matrix metalloproteinase; DAPI, 4',6-diamidino-2-phenylindole.
Figure 2.
Figure 2.
Effect of SB525334 treatment on miRNA expression in mice with experimentally induced tubulointerstitial fibrosis. (A) Total kidney RNA is extracted (n=6 per group) and miRNA expression is assessed using specific probes (Life Technologies) for miR-21 and miR-214 and is normalized to U6. One-way ANOVA with Tukey’s post hoc test is used to analyze data. ***P<0.001 versus sham animals. (B) Northern blots are performed on total kidney RNA extracted using the miRNeasy kit (Qiagen) from the kidney tissue of UUO and sham-operated animals at 7 days postsurgery and probed using 5′- digoxigenin-labeled LNA mercury probes (Exiqon) for miR-21 and miR-214. U6 is used as a loading control (Exiqon). (C) Total kidney RNA is extracted (n=6 per group) and miRNA expression is assessed using specific probes for the miR-29 family (Life Technologies) and normalized to U6. One-way ANOVA with Tukey’s post hoc test is used to analyze data. **P<0.01; ***P<0.001 versus sham animals; #P<0.05; ###P<0.001 versus UUO + vehicle. (D) In situ analysis of the location and expression of miR-21 and miR-214. 5′,3′-digoxigenin-labeled LNA mercury probes (Exiqon) are used to detect miR expression. Scale bar, 100 µM. Arrows indicate dilating tubules.
Figure 3.
Figure 3.
Effect of genetic deletion of miR-214 on tubulointerstitial fibrosis induced by UUO. miR-21−/−, miR-214−/−, and wild-type animals are subjected to sham (n=5 per group) or UUO (n=6 per group) surgery. Seven days after surgery, animals are euthanized and kidney tissue is formalin fixed; FFPE kidneys are then sectioned into 3-µM sections. (A) Picrosirius red staining is performed to assess the level of fibrosis. Fibrosis is quantified by Image Pro Plus in a blind manner. One-way ANOVA with Tukey’s post hoc test is used to analyze data. ***P<0.001; *P<0.05 versus sham; ##P<0.01 versus WT UUO. (B) Total kidney RNA is extracted using the miRNeasy kit (Qiagen) (n=5–6 per group) and gene expression is assessed using specific probes (Life Technologies) and normalized to mouse GAPDH. One-way ANOVA with Tukey’s post hoc test is used to analyze data. #P<0.05; ##P<0.01 versus WT UUO. (C) Nuclear translocation of p-Smad 2/3 is assessed on 3-µM FFPE sections (n=4 per group). Rabbit polyclonal antibody specific to p-smad 2/3 is used with a goat-anti-rabbit Alexa488 as a secondary. Quantification is performed by counting the number of positive nuclei as a percentage of all nuclei present. One-way ANOVA with Tukey’s post hoc test is used to analyze data. ###P<0.001 versus WT UUO. GAPDH, glyceraldehyde 3-phosphate dehydrogenase; NS, not significant; RQ, relative quantification; DAPI, 4',6-diamidino-2-phenylindole. Scale bar, 100 µM in A; 20 µM in C.
Figure 4.
Figure 4.
Effect of combination of SB525334 treatment and genetic deletion of miR-214 on tubulointerstitial fibrosis induced by UUO. (A) miR-214−/− mice are treated daily with SB525334 from day −1 to day 7 at a dose of 10 mg/kg by oral gavage (n=6 per group). UUO or sham surgery is performed at day 0 and animals are euthanized at +7 days. Kidney tissue is formalin fixed and FFPE kidneys are then sectioned in 3-µM sections. Picrosirius red staining is performed to assess the level of fibrosis by collagen deposition. Fibrosis is quantified by Image Pro Plus in a blind manner. The unpaired t test is used to analyze the data. **P<0.01 versus miR-214−/− UUO + vehicle. (B) Total kidney RNA is extracted (n=5 sham/n=6 UUO) and gene expression is assessed using specific probes (Life Technologies) and normalized to mouse Gapdh. One-way ANOVA with Tukey’s post hoc test is used to analyze data. *P<0.05 versus miR-214−/− + vehicle-treated animals. (C) Nuclear translocation of p-smad 2/3 is assessed on 3-µM FFPE sections (n=4 per group). Rabbit polyclonal antibody specific to p-smad 2/3 is used with a goat-anti-rabbit Alexa488 as a secondary (n=6 fields of view are blind counted per section). Quantification is performed by counting the number of positive nuclei as a percentage of all nuclei present. The unpaired t test is used to analyze the data. ***P<0.001 versus miR-214−/− + vehicle UUO. DAPI, 4',6-diamidino-2-phenylindole. Scale bar, 20 µM in C.
Figure 5.
Figure 5.
The affect of pharmacolgic deletion of miR-214 on tubulointerstital fibrosis. (A) C57bl/6 mice are subcutaneously injected with PBS, control anti-miR, anti–miR-21, or anti–miR-214 (n=10 per group) as outlined in Concise Methods, and are subjected to UUO or sham surgery. (B) Biodistribution of anti-miR-214 after subcutaneous administration is determined by a sandwich hybridization assay (see Concise Methods for details). (C) Seven days postsurgery, animals are euthanized and kidney tissue is formalin fixed. FFPE kidneys are sectioned in 3-µM sections. Picrosirius red staining is performed and the level of fibrosis is quantified by Image Pro Plus in a blind manner (n=8–10 animals). One-way ANOVA with Tukey’s post hoc test is used to analyze data. ***P<0.001 versus UUO + control anti-miR; #P<0.001 versus sham. (D) Total kidney RNA is extracted using the miRNeasy kit (Qiagen) (n=10 per group) and gene expression is assessed using specific probes (Life Technologies) and normalized to mouse Gapdh. One-way ANOVA with Tukey’s post hoc test is used to analyze data. **P<0.01 versus UUO + control anti-miR. Scale bar, 100 µM in C.
Figure 6.
Figure 6.
Mechanism of beneficial effects of miR-214 deletion. (A) Protein lysates from snap-frozen kidney tissue are prepared and quantified, and 15 μg is fractionated. Proteins are transferred onto nitrocellulose membranes and probed for NCX-1 (1:500; Swant) (nonspecific band at 70 kD and specific NCX-1 band at 116 kD) and GAPDH (1:1000). Densitometry is performed using Quantity One software (n=3 per group). One-way ANOVA with Tukey’s post hoc test is used to analyze data. *P<0.05 versus sham and wild-type UUO. (B) Total kidney RNA is extracted using a miRNeasy kit (Qiagen) (n=10 per group) and gene expression is assessed using specific probes for NCX-1 (Life Technologies) and normalized to mouse Gapdh. One-way ANOVA with Tukey’s post hoc test is used to analyze data. ***P<0.01 versus all other experimental groups. (C) C57bl/6 mice are subcutaneously injected with PBS, control anti-miR, anti–miR-21, or anti–miR-214 (n=10 per group), as outlined in the Concise Methods, and are subjected to UUO or sham surgery. Total RNA is extracted using the miRNeasy kit (Qiagen) from kidneys of mice treated with control anti-miR (n=4) or anti–miR-214 (n=4). In vitro transcription is performed using the Ambion Illumina TotalPrep RNA Amplification Kit (Life Technologies). The microarray is performed using the Illumina MouseWG-6 v2.0 Expression BeadChip Kit and data are generated using GenomeStudio (Illumina). To assess the statistical significance of pairwise intergroup differences, RP is initially used; significance is assessed using the FDR multiple testing correction method with a FDR cut-off of 5%. A secondary analysis is conducted using linear models of microarray (FDR <0.05). (D) Ingenuity pathway analysis of predicted miR-214 target genes that are significantly altered in the microarray. The green color represents significant downregulation in anti-miR-214–treated animals compared with control anti-miR–treated animals. The red color represents significant upregulation in anti-miR-214–treated animals. Gray represents no change. (E) C57bl/6 mice are subcutaneously injected with PBS, control anti-miR, anti-miR-21, or anti–miR-214 (n=10 per group) as outlined in Concise Methods, and are subjected to UUO or sham surgery. Total RNA is extracted using miRNeasy kit (Qiagen) and gene expression is assessed using specific probes for Creb1 (Life Technologies) and normalized to mouse Gapdh. One-way ANOVA with Tukey’s post hoc test is used to analyze data. #P<0.05 versus UUO + control anti-miR. GAPDH, glyceraldehyde 3-phosphate dehydrogenase; LIMMA, linear models of microarray; MMP, matrix metalloproteinase; TIMP, tissue inhibitor of metalloproteinase; UTR, untranslated region.
Figure 7.
Figure 7.
Antiapoptotic effect of miR-214 antagonism in the kidney. (A) Wild-type and miR-214−/− animals are subjected to sham (n=5 per group) or UUO (n=6 per group) surgery. Animals are euthanized and kidney tissue is formalin fixed 7 days after surgery. Apoptosis is assessed by TUNEL staining on 3-µM FFPE sections (n=3 per group is assessed in a blind fashion with six fields of view counted per section). Quantification is performed by counting number of positive nuclei as a percentage of all nuclei present. One-way ANOVA with Tukey’s post hoc test is used to analyze data. ***P<0.001 versus wild-type UUO. (B) C57bl/6 mice are subcutaneously injected with PBS, control anti-miR, or anti–miR-214 (n=10 per group) as outlined in Concise Methods and had either UUO or sham surgery performed. Animals are euthanized and kidney tissue formalin fixed 7 days after surgery. Apoptosis is assessed by TUNEL staining on 3-µM FFPE sections. Quantification is performed by counting number of positive nuclei as a percentage of all nuclei present. One-way ANOVA with Tukey’s post hoc test is used to analyze data. ###P<0.001 versus UUO + control anti-miR. (C) Caspase-Glo 3/7 activity assay (Promega) is performed on protein lysates (n=6 per group) from C57bl/6 mice are subcutaneously injected with PBS, control anti-miR, or anti–miR-214 (as outlined in Concise Methods) and are subjected to UUO or sham surgery. Animals are euthanized 7 days after surgery. One-way ANOVA with Tukey’s post hoc test is used to analyze data. ###P<0.001 versus UUO + control anti-miR. (D) C57bl/6 mice are subcutaneously injected with PBS, control anti-miR, anti-miR-21, or anti-miR-214 (n=10 per group) as outlined in Concise Methods, and are subjected to UUO or sham surgery. Total RNA is extracted using a miRNeasy kit (Qiagen) and gene expression is assessed using specific probes for Psmd10 (Life Technologies) and normalized to mouse Gapdh. One-way ANOVA with Tukey’s post hoc test is used to analyze data. ###P<0.01 versus UUO + control anti-miR. DAPI, 4',6-diamidino-2-phenylindole; RQ, relative quantification. Scale bar, 20 µM in A and B.
Figure 8.
Figure 8.
Evaluation of miR-214 expression in normal human kidneys and in CKD. In situ analysis of miR-214 expression is performed on human control renal tissue and biopsy tissue with H&E contiguous section. 5′,3′-digoxigenin-labeled LNA mercury probes (Exiqon) are used to detect miR expression. The asterisk indicates the nucleolus. H&E, hematoxylin and eosin. Scale bar, 100 µM.

References

    1. Bohle A, Mackensen-Haen S, von Gise H: Significance of tubulointerstitial changes in the renal cortex for the excretory function and concentration ability of the kidney: A morphometric contribution. Am J Nephrol 7: 421–433, 1987 - PubMed
    1. Liu Y: Renal fibrosis: New insights into the pathogenesis and therapeutics. Kidney Int 69: 213–217, 2006 - PubMed
    1. Eddy AA, Neilson EG: Chronic kidney disease progression. J Am Soc Nephrol 17: 2964–2966, 2006 - PubMed
    1. Sharma K, Jin Y, Guo J, Ziyadeh FN: Neutralization of TGF-beta by anti-TGF-beta antibody attenuates kidney hypertrophy and the enhanced extracellular matrix gene expression in STZ-induced diabetic mice. Diabetes 45: 522–530, 1996 - PubMed
    1. Grygielko ET, Martin WM, Tweed C, Thornton P, Harling J, Brooks DP, Laping NJ: Inhibition of gene markers of fibrosis with a novel inhibitor of transforming growth factor-β type I receptor kinase in puromycin-induced nephritis. J Pharmacol Exp Ther 313: 943–951, 2005 - PubMed

Publication types

MeSH terms