. 2013 Aug 1;8(4):439-447.
doi: 10.1016/j.nantod.2013.07.004.

Triggered Nanoparticles as Therapeutics

Affiliations

Triggered Nanoparticles as Therapeutics

Chang Soo Kim et al. Nano Today. .

Abstract

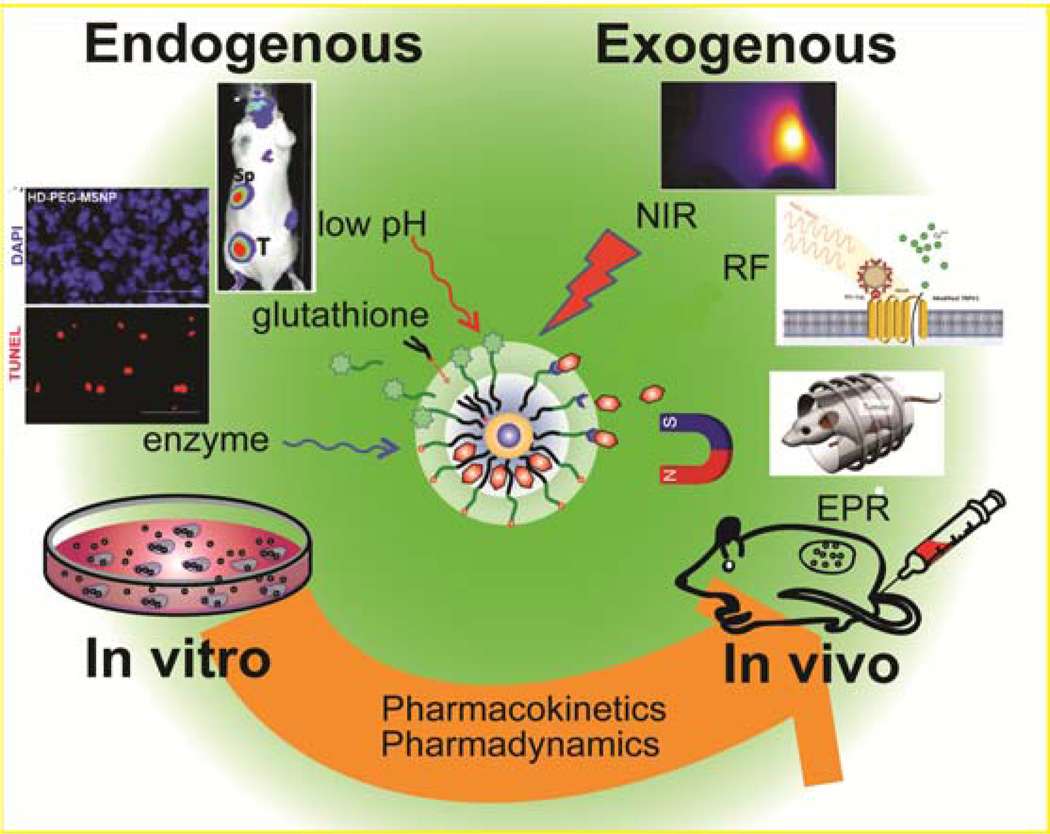
Drug delivery systems (DDSs) face several challenges including site-specific delivery, stability, and the programmed release of drugs. Engineered nanoparticle (NP) surfaces with responsive moieties can enhance the efficacy of DDSs for in vitro and in vivo systems. This triggering process can be achieved through both endogenous (biologically controlled release) and exogenous (external stimuli controlled release) activation. In this review, we will highlight recent examples of the use of triggered release strategies of engineered nanomaterials for in vitro and in vivo applications.

Keywords: Engineered nanoparticles; drug delivery system; in vitro; in vivo; triggered release.


Figures

Figure 1
Figure 1
Triggered nanomaterials for endogenous and exogenous drug release in vitro and in vivo.
Figure 2
Figure 2
(a) Magnetic hyperthermia treatment apparatus. (b) Mice xenografted with U87MG cancer cells before treatment (upper row, dotted circle) and 18 days after treatment (lower row). (c) Treatment with core–shell NP hyperthermia, Dox, Feridex hyperthermia, alternating current (a.c.) field only, core–shell NPs only or untreated control versus tumor volume (V/Vinitial). (d) Immunofluorescence images of the tumor region after nanoparticle mediated hyperthermia treatment (upper image) and the control tumor region (lower image). (e) Dose versus tumor volume measured 18 days after treatment. Reprinted with permission from [27].
Figure 3
Figure 3
Change in tumor size (a) and corresponding image (b) after one NIR laser irradiation (808 nm, 4W/cm2) at 24 hrs after injection with gold nanorods (GNR), polymer conjugated nanocarrier GNRs (NC-GNRs), and chitosan conjugated NC-GNRs (Chito-NC-GNRs). Change in tumor size (c) and corresponding image (d) after irradiation at both 24 hrs and 48 hrs after nanorod injection. Reprinted with permission from [31].
Figure 4
Figure 4
Polymer coated Au nanocages for the controlled release of encapsulated Dox. (a) Structure of Au nanocage with thermally responsive polymer upon laser irradiation. (b) Molecular structure of p(NIPAAm-co-AAm) co-polymer on Au nanocage surface. (c) Cell viability of SK-BR-3 breast cancer cells exposed to: (C-1) 2 min of NIR laser pulse in the absence of nanocages, (C-2) 2 min of NIR laser pulse in the presence of Dox-free nanocages, and 2/5 min of NIR irradiation in presence of Dox-loaded nanocages. Reprinted with permission from [43].
Figure 5
Figure 5
An exogenously controlled supramolecular nanotherapeutic. (a) Structure of AuNP-NH2 and CB[7]. (b) Triggered cytotoxicity by the dethreading of CB[7] from the AuNP-NH2 by ADA. (c) Exogenous triggering of cytotoxicity using ADA. To MCF-7 cells incubated with AuNP– NH2–CB[7] complexes, different concentrations (0, 0.2 and 0.4 mM) of ADA in medium were added generating cytotoxic AuNP-NH2. Reprinted with permission from [44].
Figure 6
Figure 6
Circulation profiles of pH sensitive NPs. (a) Amount of remaining NPs in circulation over time. Quantum dot (QD), poly-l-lysine (PLL), PPL modified with iminobiotin (PPLib), PLL functionalized with biotin (PLLb), neutravidin (nav), biotin end-functionalized PEG (PEG). (b) Accumulation and clearance of LbL NPs in mice with induced MDA-MB-435 tumors (left hind flank). Tumor (T), spleen (Sp). (c) LbL NP accumulation levels in tumors at 8 h. (d) Rate of clearance of NPs from tumors. Reprinted with permission from [52].
Figure 7
Figure 7
(a) Synthetic scheme for the NPs. (b) Protease triggered release from the loaded mesoporous silica NPs. (c) Immunoblots for caspase protein levels as well as the GAPDH from tumor lysates of animals 60 h after injection. (d) Staining for apoptotic cells in the collected tumor sections. Scale bars are 50 µm. Reprinted with permission from [59].
Figure 8
Figure 8
Intracellular stability of QD monolayers determined by mass spectrometry. (a) Structure of QDs studied. (b) Percentage of monolayers retained within HeLa cells at 3, 6, 9, and 24 hrs. Reprinted with permission from [67].

References

    1. Yu X, Zhang Y, Chen C, Yao Q, Li M. Biochim. Biophys. Acta. 2010;1805:97–104. - PMC - PubMed
    1. Schroeder A, Heller DA, Winslow MM, Dahlman JE, Pratt GW, Langer R, Jacks T, Anderson DG. Nat. Rev. Cancer. 2012;12:39–50. - PubMed
    1. Allen TM, Cullis PR. Science. 2004;303:1818–1822. - PubMed
    1. Dreher MR, Liu W, Michelich CR, Dewhirst MW, Yuan F, Chilkoti A, Natl J. Cancer Inst. 2006;98:335–344. - PubMed
    1. Ghosh P, Han G, De M, Kim CK, Rotello VM. Adv. Drug Deliv. Rev. 2008;60:1307–1315. - PubMed

LinkOut - more resources