. 2013 Oct 25;2(1):17.
doi: 10.1186/2047-1440-2-17.

Standardization of whole blood immune phenotype monitoring for clinical trials: panels and methods from the ONE study

Affiliations

Standardization of whole blood immune phenotype monitoring for clinical trials: panels and methods from the ONE study

Mathias Streitz et al. Transplant Res. .

Abstract

Background: Immune monitoring by flow cytometry is a fast and highly informative way of studying the effects of novel therapeutics aimed at reducing transplant rejection or treating autoimmune diseases. The ONE Study consortium has recently initiated a series of clinical trials aimed at using different cell therapies to promote tolerance to renal allografts. To compare the effectiveness of different cell therapies, the consortium developed a robust immune monitoring strategy, including procedures for whole blood (WB) leukocyte subset profiling by flow cytometry.

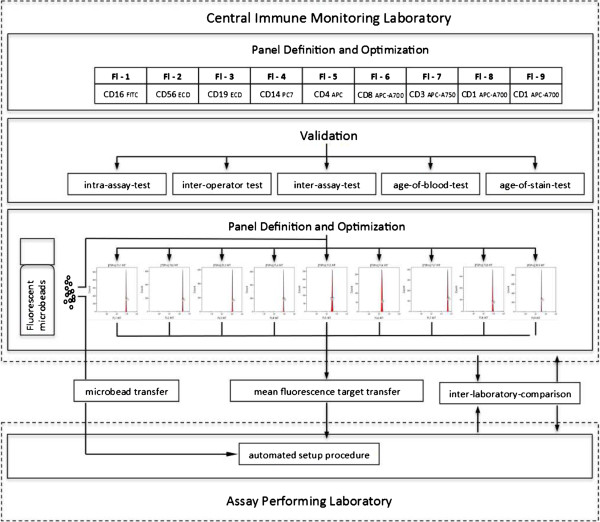
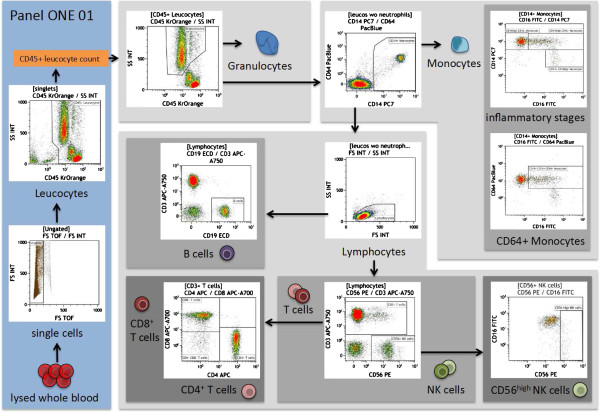
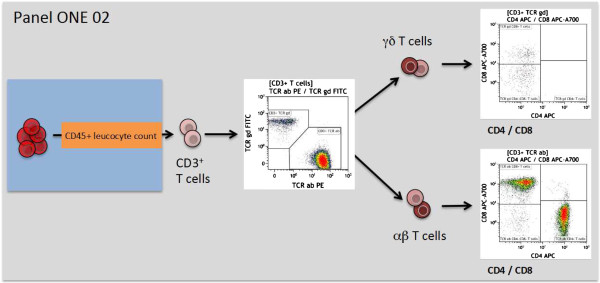
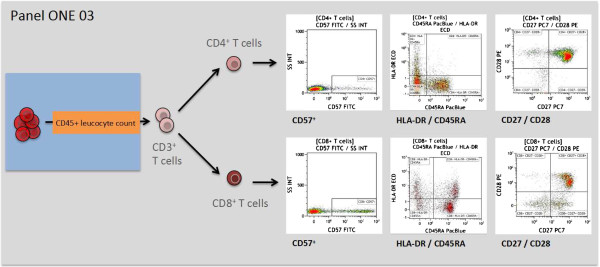
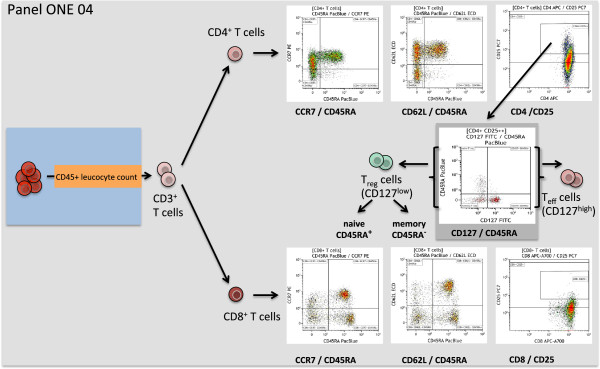
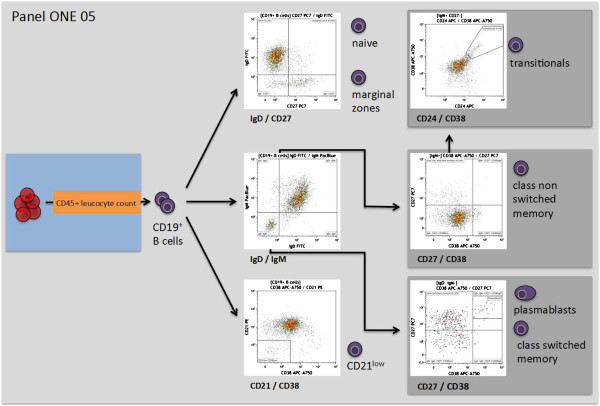
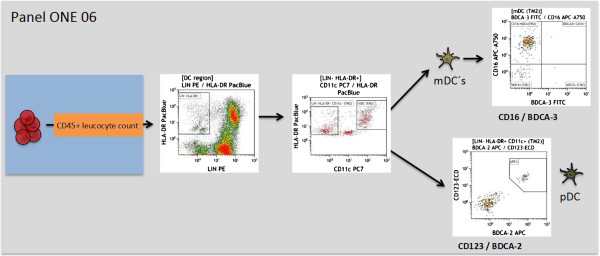
Methods: Six leukocyte profiling panels computing 7- to 9-surface marker antigens for monitoring the major leukocyte subsets as well as characteristics of T cell, B cell, and dendritic cell (DC) subsets were designed. The precision and variability of these panels were estimated. The assay was standardized within eight international laboratories using Flow-Set Pro beads for mean fluorescence intensity target definition and the flow cytometer setup procedure. Standardization was demonstrated by performing inter-site comparisons.

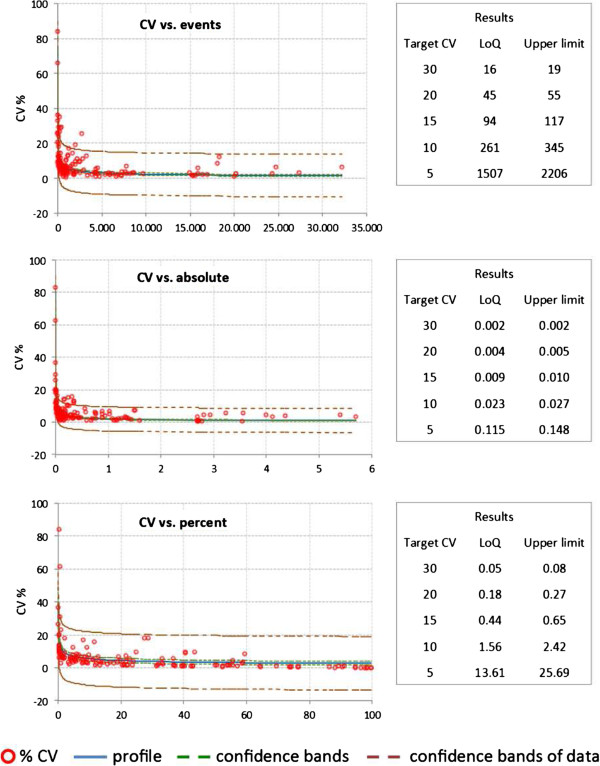
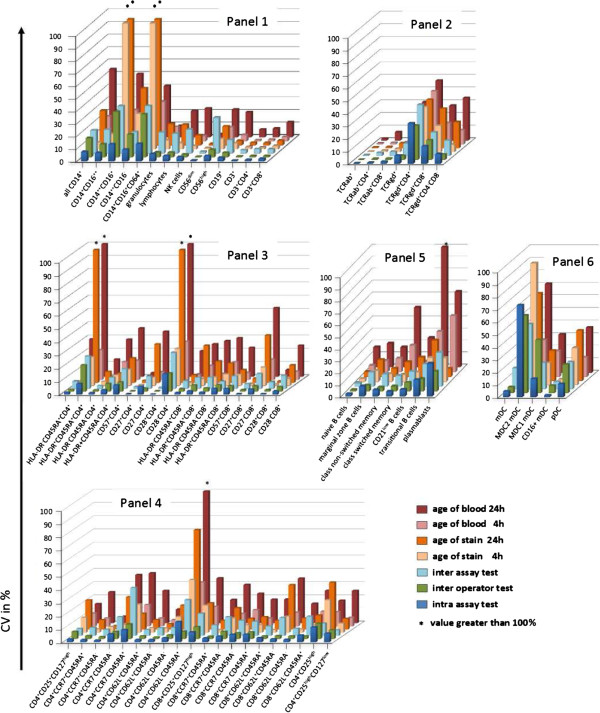
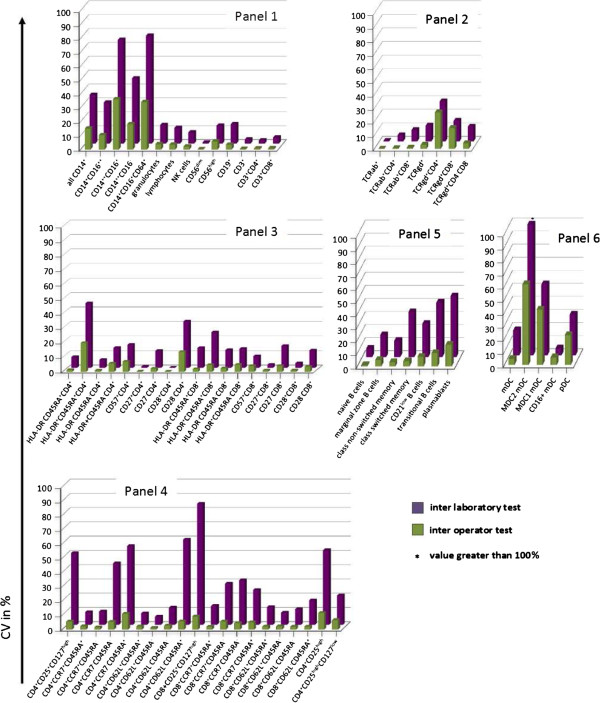
Results: Optimized methods for sample collection, storage, preparation, and analysis were established, including protocols for gating target subsets. WB specimen age testing demonstrated that staining must be performed within 4 hours of sample collection to keep variability low, meaning less than or equal to 10% for the majority of defined leukocyte subsets. Inter-site comparisons between all participating centers testing shipped normal WB revealed good precision, with a variability of 0.05% to 30% between sites. Intra-assay analyses revealed a variability of 0.05% to 20% for the majority of subpopulations. This was dependent on the frequency of the particular subset, with smaller subsets showing higher variability. The intra-assay variability performance defined limits of quantitation (LoQ) for subsets, which will be the basis for assessing statistically significant differences achieved by the different cell therapies.

Conclusions: Local performance and central analysis of the ONE Study flow cytometry panel yields acceptable variability in a standardized assay at multiple international sites. These panels and procedures with WB allow unmanipulated analysis of changes in absolute cell numbers of leukocyte subsets in single- or multicenter clinical trials. Accordingly, we propose the ONE Study panel may be adopted as a standardized method for monitoring patients in clinical trials enrolling transplant patients, particularly trials of novel tolerance promoting therapies, to facilitate fair and meaningful comparisons between trials.


Figures

Figure 1
Figure 1
Overview of panel design, standardization, and validation within the ONE-Study.
Figure 2
Figure 2
Overview of the gating strategy for panel ONE 01: general immune phenotype, using the sample of a healthy individual. The data file of the stained lysed (EDTA spiked) whole blood (WB) was analyzed as follows: exclusion of non-single events (forward scatter time of flight versus forward scatter integral); gating of CD45+ leukocytes (anti-CD45 versus sideward scatter integral) – the counted CD45+ events were used as the reference for calculating the absolute cell number of indicated populations in WB; gating and exclusion of granulocytes (anti-CD45 versus sideward scatter integral); gating and exclusion of all CD14+ monocytes (anti-CD14 versus anti-CD64) – the gated CD14+ monocytes were used to further discriminate different inflammatory/differentiation stages of monocytes (anti-CD16 versus anti-CD14) resulting in CD14++CD16- classical monocytes, CD14++CD16+ and CD14+CD16++ monocytes, and anti-CD16 versus anti-CD64 to capture CD16+CD64+ monocytes; gating of lymphocytes (forward scatter integral versus sideward scatter integral); gating of CD56+NK cells, which were further subdivided into CD56dim and CD56highNK cells; gating of CD3+ T cells (anti-CD56 versus anti-CD3) – gated T cells were used for identification of CD4+ T-cells and CD8+ T-cells (anti-CD4 versus anti-CD8), and the gated lymphocytes were also used for identification of the B cell population (anti-CD19 versus anti-CD3). WB, whole blood.
Figure 3
Figure 3
Overview of the gating strategy for panel ONE 02: T cell subsets/αβ+ T cells and γδ+ T cells. The data file of the stained lysed (EDTA spiked) whole blood (WB) was analyzed as follows: exclusion of non-single events and gating of CD45+ leukocytes as shown for panel ONE 01 (Figure 2); gating of CD3+ T cells (anti-CD3 versus sideward scatter); gating of αβ+ T cells and γδ+ T cells (anti-T cell receptor αβ+ T cells versus anti-T cell receptor γδ+); and gating of CD4+ and CD8+ T cells for both T cell receptor subsets (anti-CD4 versus anti-CD8). WB, whole blood.
Figure 4
Figure 4
Overview of the gating strategy for panel ONE 03: T cell activation. Expression of CD57 or HLA-DR and loss of CD27 or CD28 expression was used as a sign of T cell activation, as previously described [27-32]. The data file of the stained lysed (EDTA spiked) whole blood (WB) was analyzed as follows: exclusion of non-single events and gating of CD45+ leukocytes as shown for panel ONE 01 (Figure 2); gating of CD3+ T cells (anti-CD3 versus sideward scatter); and gating of CD4+ as well the CD8+ T cells (anti-CD4 versus anti-CD8), for both subsets gating on CD57+ cells (anti-CD57 versus sideward scatter), HLA-DR+/CD45RA+ (naive, and HLA-DR+/CD45RA- (memory), and CD27-/+ and CD28-/+ subsets (anti-CD27 versus anti-CD28). WB, whole blood.
Figure 5
Figure 5
Overview of the gating strategy for panel ONE 04: memory T cells and regulatory T cells. The data file of the stained lysed (EDTA spiked) whole blood (WB) was analyzed as follows: exclusion of non-single events and gating of CD45+ leukocytes as shown for panel ONE 01 (Figure 2); gating of CD3+ T cells (anti-CD3 versus sideward scatter); gating of CD4+ as well the CD8+ T cells (anti-CD4 versus anti-CD8), for both subsets gating of naive (CCR7+ or CD62L+ and CD45RA+), central memory (CCR7+ or CD62L+ and CD45RA-), effector memory (CCR7- or CD62L- and CD45RA-), and TEMRA (CCR7- or CD62L- and CD45RA+) subsets, as reported recently [33,34]. CD4+CD25++ were further separated into CD127low regulatory T cells, discriminating CD45RA+ naive and CD45RA- memory regulatory T cells, and CD127high activated effector T cells [35]. We also enumerated activated CD8+CD25++ cells. WB, whole blood.
Figure 6
Figure 6
Overview of the gating strategy for panel ONE 05: B cell subsets. Identification of B cell subsets was based on previously published classifications [36,37]. The data file of the stained lysed (EDTA spiked) whole blood (WB) was analyzed as follows: exclusion of non-single events and gating of CD45+ leukocytes as shown for panel ONE 01 (Figure 2); gating of CD19+ B cells (anti-CD19 versus sideward scatter); gating of CD21low B cells (anti-CD38 versus anti-CD21); gating of IgD-IgM- and IgM+ B cells (anti-IgD versus anti-IgM). Pre-gated IgD-IgM- B cells were further used to identify plasmablasts (CD27+CD38high) and class-switched memory B cells (CD27+CD38low), pre-gated IgM+ B cells were used to identify of class non-switched memory B cells (CD27+CD38low), and the pre-gated IgM+CD27- B cells were used to identify transitional B cells (CD24+CD28high). WB, whole blood.
Figure 7
Figure 7
Overview of the gating strategy for panel ONE 06: dendritic cell (DC) subsets. DCs and their subpopulations were identified, as previously reported [38-41]. The data file of the stained lysed (EDTA spiked) whole blood (WB) was analyzed as follows: exclusion of non-single events and gating of CD45+ leukocytes as shown for panel ONE 01 (Figure 2); gating of lineage (LIN; anti-CD3, anti-CD14, anti-CD19, anti-CD20, anti-CD56) negative HLA-DR+ cells, identification of LIN-HLA-DR+CD11c+ myeloid DCs (mDCs), and LIN-HLA-DR+CD11c- cells (anti-CD11c versus anti-HLA-DR). Pre-gated mDCs were used to identify CD16+, mDC1, and BDCA3+mDC subsets, and pre-gated LIN-HLA-DR+CD11c- cells were used to identify plasmacytoid DCs (CD123+BDCA2+). DC, dendritic cell; mDC, myeloid dendritic cell; LIN, lineage; WB, whole blood.
Figure 8
Figure 8
Single CV values of all cell subsets tested within intra-assays (whole blood (WB) material from two healthy individuals; 71 single subsets = 142 data points). CV values include five replicates assayed in parallel. Shown are the function, regression, and 95% confidence interval of the CV versus counted events, CV versus calculated absolute cell number of the gated subpopulations, and CV versus percentage of the gated subpopulation. Also shown are the calculated lower limits of quantitation (LoQ) and the upper LoQ for a given CV. CV, coefficient of variation; LoQ, limit of quantitation; WB, whole blood.
Figure 9
Figure 9
Mean CVs of cell subsets tested in intra-assay test, inter-operator-test, and inter-assay test, and also the change from baseline for the age-of-stain test 4 hours + 24 hours and the age-of-blood test 4 hours + 24 hours for all six panels. Panel ONE 01, general immune status; panel ONE 02, T cell subsets/αβ+ T cells and γδ+ T cells; panel ONE 03, T cell activation; panel ONE 04, T cell memory and regulatory T cells; panel ONE 05, B cell subsets; and panel ONE 06, dendritic cell (DC) subsets. CV, coefficient of variation; DC, dendritic cell.
Figure 10
Figure 10
Mean CVs of cell subsets tested in inter-operator test and inter-laboratory test for all six panels. Panel ONE 01, general immune status; panel ONE 02, T cell subsets/αβ+ T cells and γδ+ T cells; panel ONE 03, T cell activation; panel ONE 04, T cell memory and regulatory T cells; Panel ONE 05, B cell subsets; and panel ONE 06, dendritic cell (DC) subsets. CV, coefficient of variation; DC, dendritic cell.

References

    1. Battaglia M, Roncarolo MG. Immune intervention with T regulatory cells: past lessons and future perspectives for type 1 diabetes. Semin Immunol. 2011;23(3):182–194. doi: 10.1016/j.smim.2011.07.007. - DOI - PubMed
    1. Broichhausen C, Riquelme P, Geissler EK, Hutchinson JA. Regulatory macrophages as therapeutic targets and therapeutic agents in solid organ transplantation. Curr Opin Organ Trans. 2012;17(4):332–342. - PubMed
    1. Ezzelarab M, Thomson AW. Tolerogenic dendritic cells and their role in transplantation. Semin Immunol. 2011;23(4):252–263. doi: 10.1016/j.smim.2011.06.007. - DOI - PMC - PubMed
    1. Schliesser U, Streitz M, Sawitzki B. Tregs: application for solid-organ transplantation. Curr Opinion Organ Trans. 2012;17(1):34–41. doi: 10.1097/MOT.0b013e32834ee69f. - DOI - PubMed
    1. Brunstein CG, Miller JS, Cao Q, McKenna DH, Hippen KL, Curtsinger J, Defor T, Levine BL, June CH, Rubinstein P, McGlave PB, Blazar BR, Wagner JE. Infusion of ex vivo expanded T regulatory cells in adults transplanted with umbilical cord blood: safety profile and detection kinetics. Blood. 2011;117(3):1061–1070. doi: 10.1182/blood-2010-07-293795. - DOI - PMC - PubMed