

High-throughput sequencing of small RNA transcriptomes reveals critical biological features targeted by microRNAs in cell models used for squamous cell cancer research
- PMID: 24160351
- PMCID: PMC3870990
- DOI: 10.1186/1471-2164-14-735
High-throughput sequencing of small RNA transcriptomes reveals critical biological features targeted by microRNAs in cell models used for squamous cell cancer research
Abstract
Background: The implication of post-transcriptional regulation by microRNAs in molecular mechanisms underlying cancer disease is well documented. However, their interference at the cellular level is not fully explored. Functional in vitro studies are fundamental for the comprehension of their role; nevertheless results are highly dependable on the adopted cellular model. Next generation small RNA transcriptomic sequencing data of a tumor cell line and keratinocytes derived from primary culture was generated in order to characterize the microRNA content of these systems, thus helping in their understanding. Both constitute cell models for functional studies of microRNAs in head and neck squamous cell carcinoma (HNSCC), a smoking-related cancer. Known microRNAs were quantified and analyzed in the context of gene regulation. New microRNAs were investigated using similarity and structural search, ab initio classification, and prediction of the location of mature microRNAs within would-be precursor sequences. Results were compared with small RNA transcriptomic sequences from HNSCC samples in order to access the applicability of these cell models for cancer phenotype comprehension and for novel molecule discovery.
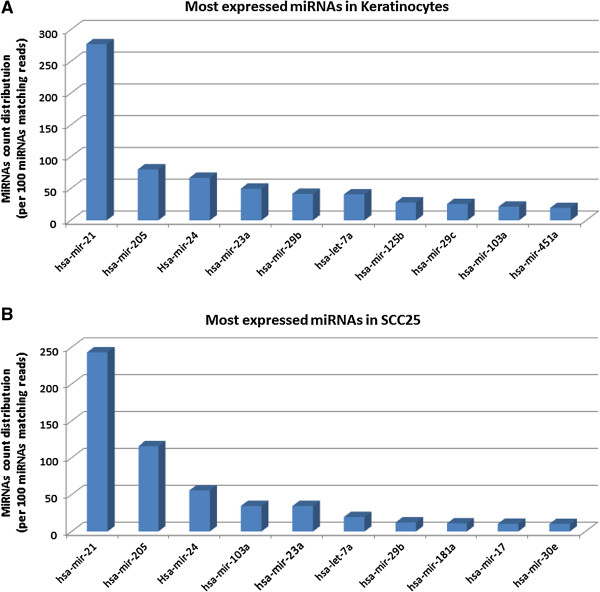
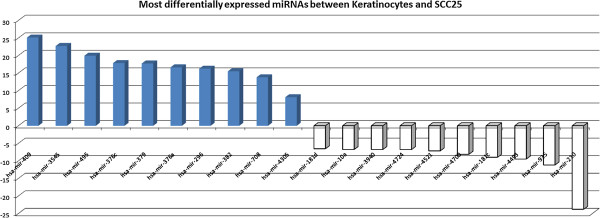
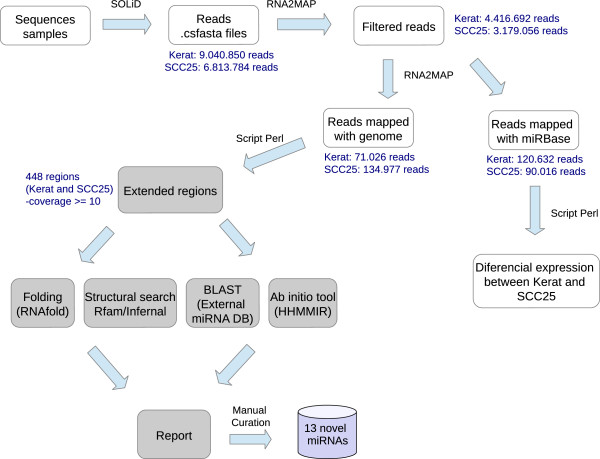
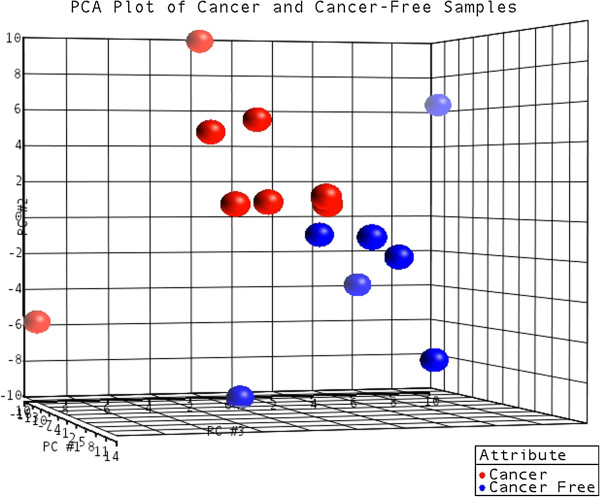
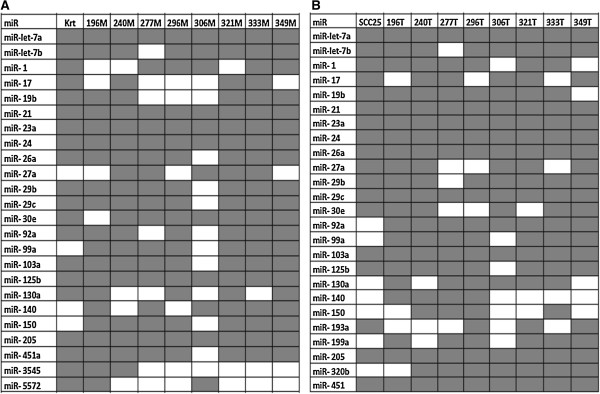
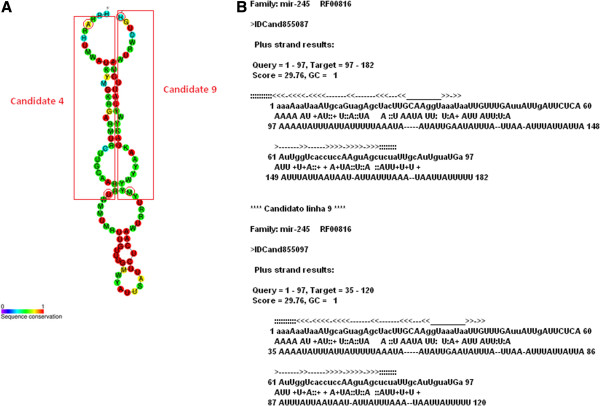
Results: Ten miRNAs represented over 70% of the mature molecules present in each of the cell types. The most expressed molecules were miR-21, miR-24 and miR-205, Accordingly; miR-21 and miR-205 have been previously shown to play a role in epithelial cell biology. Although miR-21 has been implicated in cancer development, and evaluated as a biomarker in HNSCC progression, no significant expression differences were seen between cell types. We demonstrate that differentially expressed mature miRNAs target cell differentiation and apoptosis related biological processes, indicating that they might represent, with acceptable accuracy, the genetic context from which they derive. Most miRNAs identified in the cancer cell line and in keratinocytes were present in tumor samples and cancer-free samples, respectively, with miR-21, miR-24 and miR-205 still among the most prevalent molecules at all instances. Thirteen miRNA-like structures, containing reads identified by the deep sequencing, were predicted from putative miRNA precursor sequences. Strong evidences suggest that one of them could be a new miRNA. This molecule was mostly expressed in the tumor cell line and HNSCC samples indicating a possible biological function in cancer.
Conclusions: Critical biological features of cells must be fully understood before they can be chosen as models for functional studies. Expression levels of miRNAs relate to cell type and tissue context. This study provides insights on miRNA content of two cell models used for cancer research. Pathways commonly deregulated in HNSCC might be targeted by most expressed and also by differentially expressed miRNAs. Results indicate that the use of cell models for cancer research demands careful assessment of underlying molecular characteristics for proper data interpretation. Additionally, one new miRNA-like molecule with a potential role in cancer was identified in the cell lines and clinical samples.
Figures
References
Publication types
MeSH terms
Substances
LinkOut - more resources
Full Text Sources
Other Literature Sources
Medical
Molecular Biology Databases
