. 2013 Oct 11;111(15):153902.
doi: 10.1103/physrevlett.111.153902. Epub 2013 Oct 10.

Measuring large optical transmission matrices of disordered media

Affiliations

Measuring large optical transmission matrices of disordered media

Hyeonseung Yu et al. Phys Rev Lett. .

Abstract

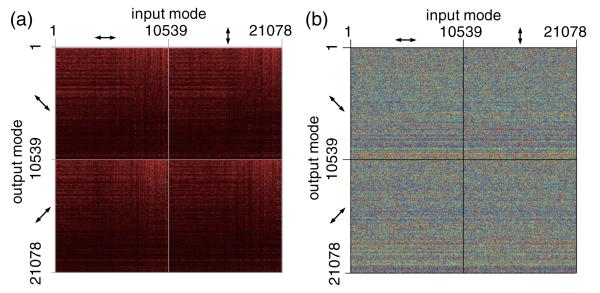
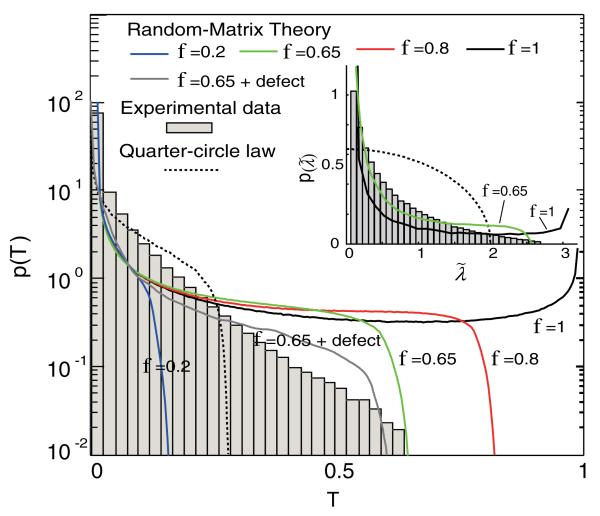
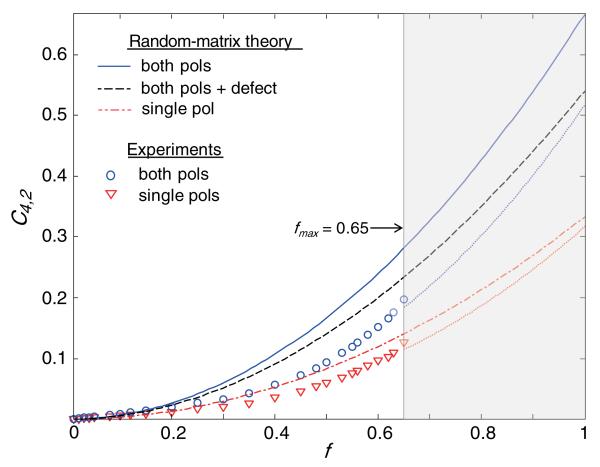
We report a measurement of the large optical transmission matrix (TM) of a complex turbid medium. The TM is acquired using polarization-sensitive, full-field interferometric microscopy equipped with a rotating galvanometer mirror. It is represented with respect to input and output bases of optical modes, which correspond to plane wave components of the respective illumination and transmitted waves. The modes are sampled so finely in angular spectrum space that their number exceeds the total number of resolvable modes for the illuminated area of the sample. As such, we investigate the singular value spectrum of the TM in order to detect evidence of open transmission channels, predicted by random-matrix theory. Our results comport with theoretical expectations, given the experimental limitations of the system. We consider the impact of these limitations on the usefulness of transmission matrices in optical measurements.


Figures

FIG. 1
FIG. 1
(color online) Experimental setup. (Inset) scanning electron micrograph of a ZnO sample (cross section).
FIG. 2
FIG. 2
(color online) (a) Amplitude and (b) phase of the reconstructed TM (a sampled representation of the rows and columns is shown). Row and column numbers indicate the spatial frequency mode indices of the outgoing and incoming complex wave fields, respectively. Arrows represent polarization direction.
FIG. 3
FIG. 3
(color online) Transmission eigenvalue distribution of the measured TM. The lines represent RMT simulations with full information (black line), information on only a fraction f 0.65 of the incident and transmitted modes (green line), and incorporation of an additional defect factor of 24% (gray line). Dashed line represents distribution from the quarter-circle law. (Inset) Normalized singular values distribution of the measured TM.
FIG. 4
FIG. 4
(color online) Measured and ideal values for C4,2 as a function of f. Dotted lines represent extrapolations from the measurements.

References

    1. Popoff S, Lerosey G, Fink M, Boccara AC, Gigan S. Nat. Commun. 2010;1:81. - PubMed
    1. Choi Y, Yang TD, Fang-Yen C, Kang P, Lee KJ, Dasari RR, Feld MS, Choi W. Phys. Rev. Lett. 2011;107:023902. - PMC - PubMed
    1. Ott JR, Mortensen A, Lodahl P. Phys. Rev. Lett. 2010;105:090501. - PubMed
    1. Beenakker CWJ. Rev. Mod. Phys. 1997;69:731.
    1. Skipetrov SE. Phys. Rev. E. 2003;67:036621. - PubMed

Publication types

MeSH terms