. 2014 Jan;21(1):41-63.
doi: 10.1089/cmb.2012.0277. Epub 2013 Oct 26.

The distribution of word matches between Markovian sequences with periodic boundary conditions

Affiliations

The distribution of word matches between Markovian sequences with periodic boundary conditions

Conrad J Burden et al. J Comput Biol. 2014 Jan.

Abstract

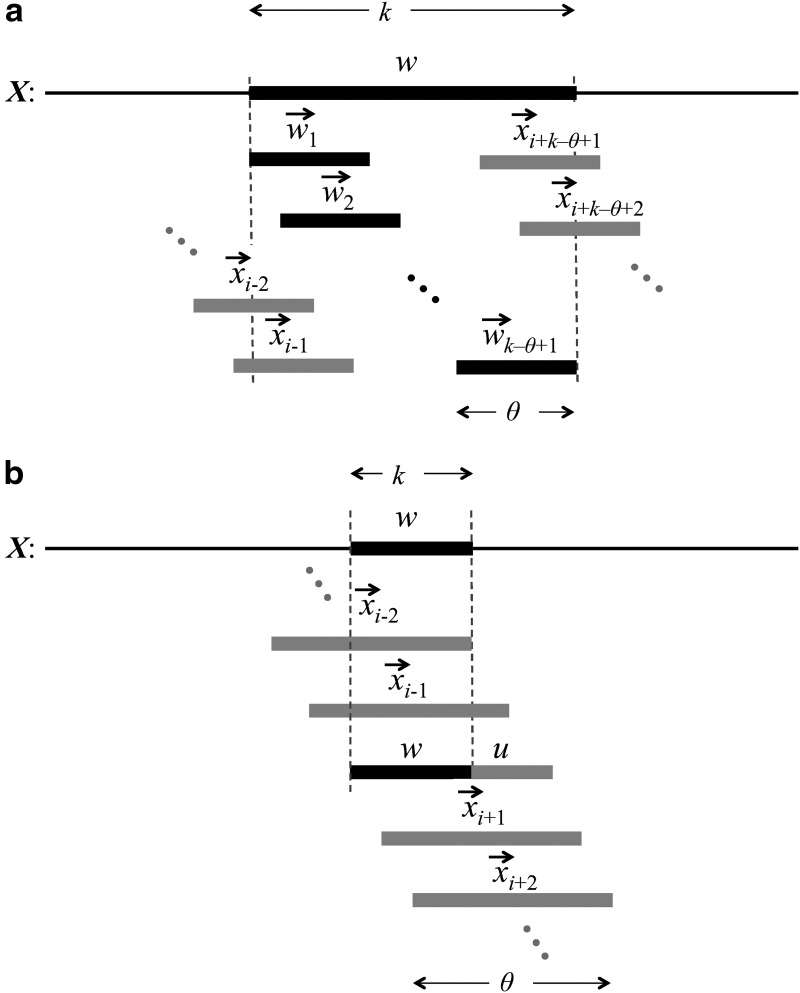
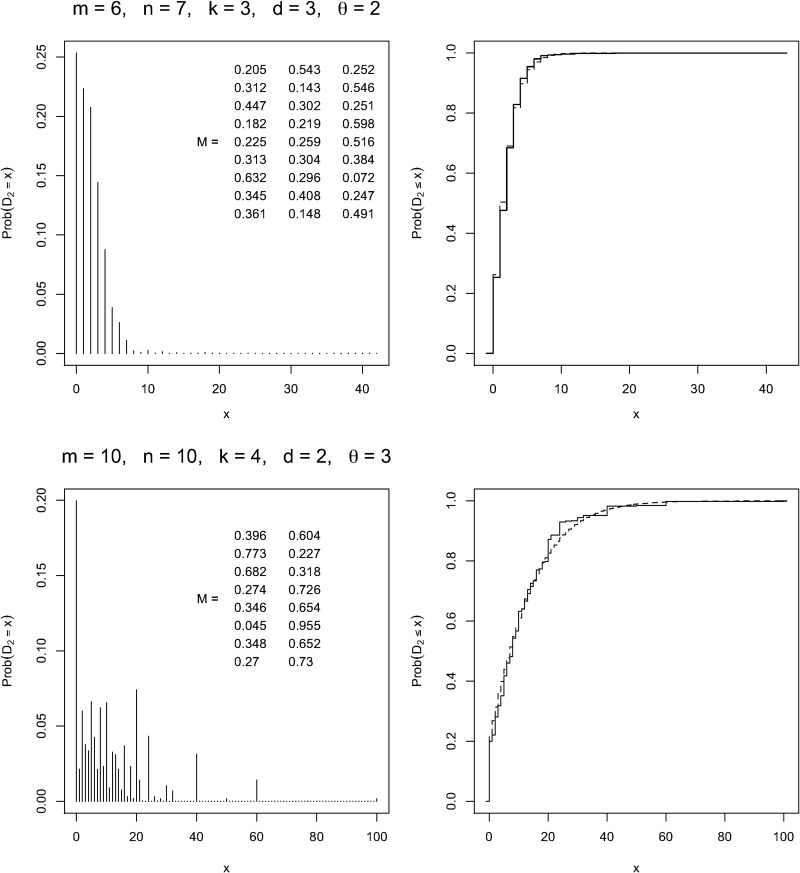
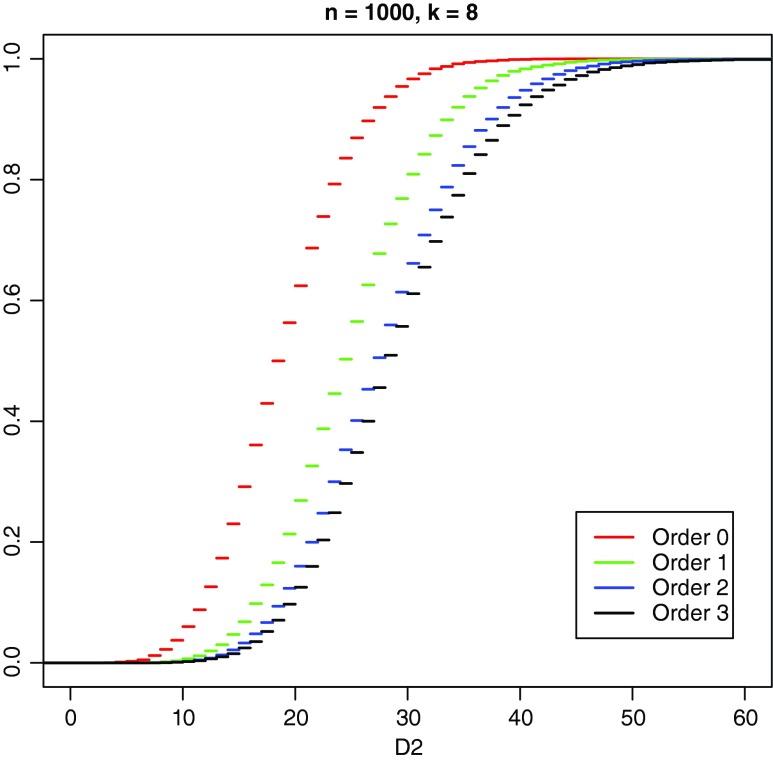
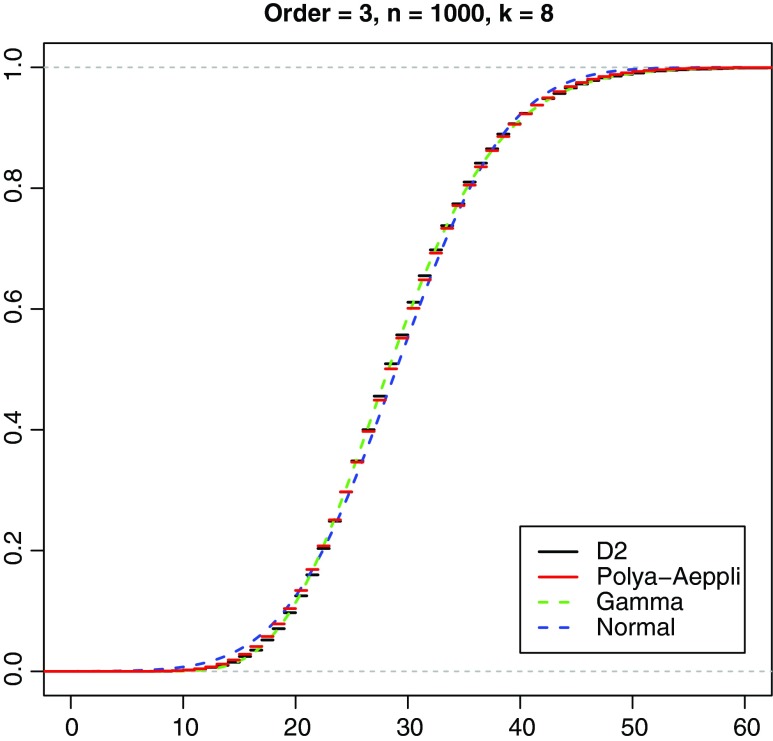
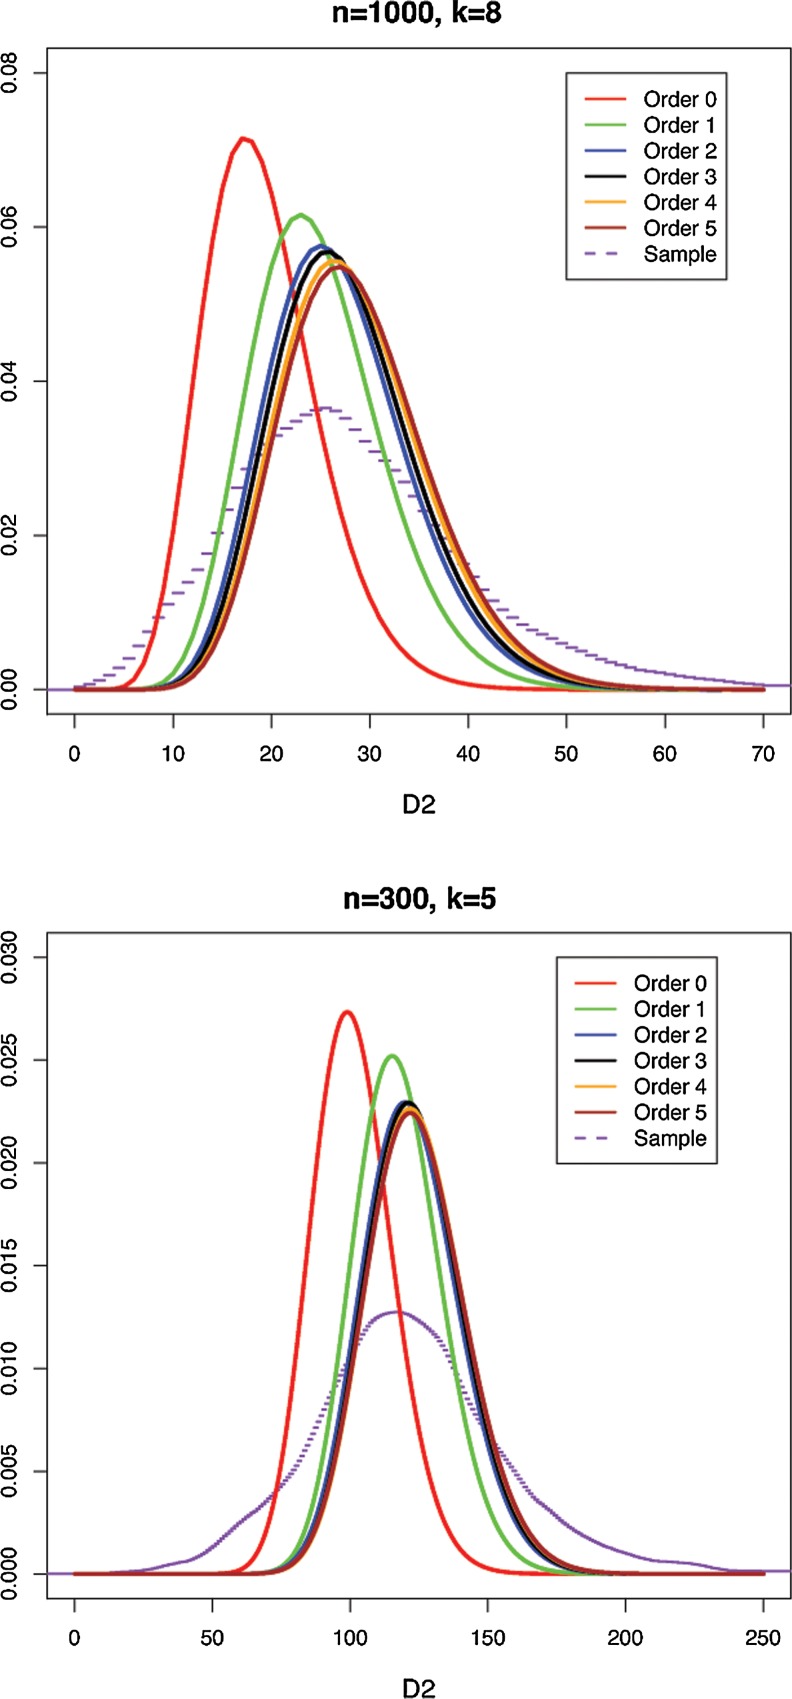
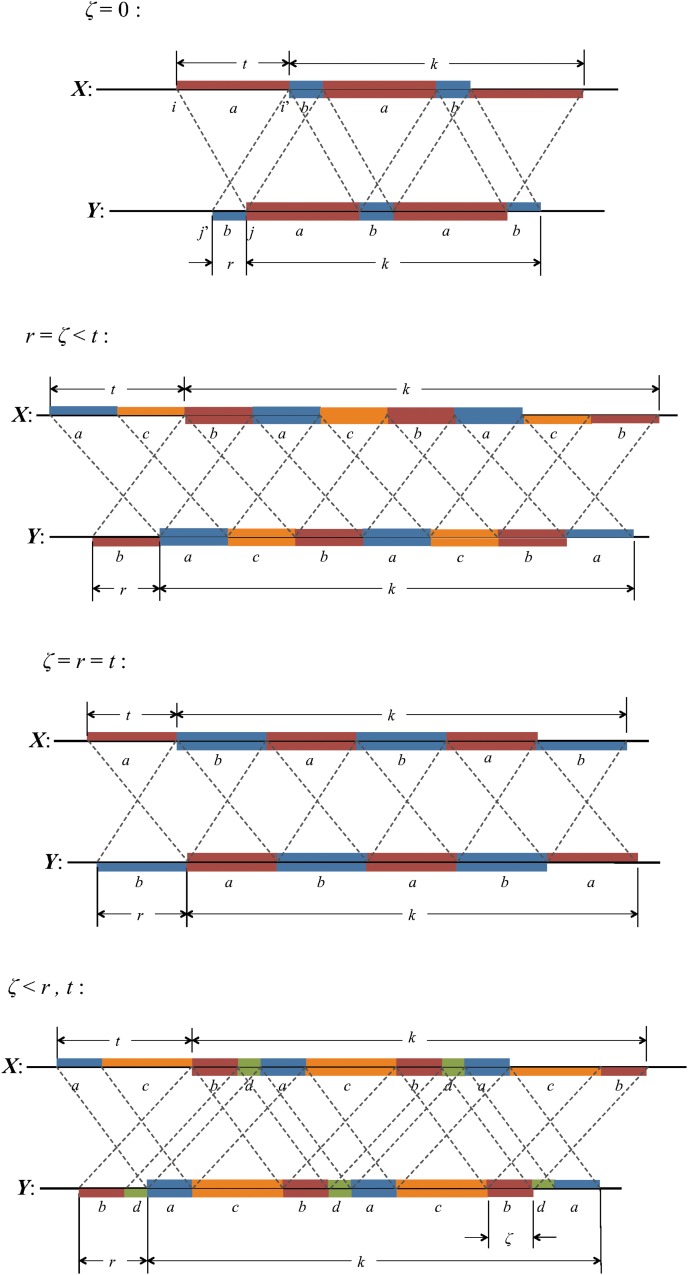
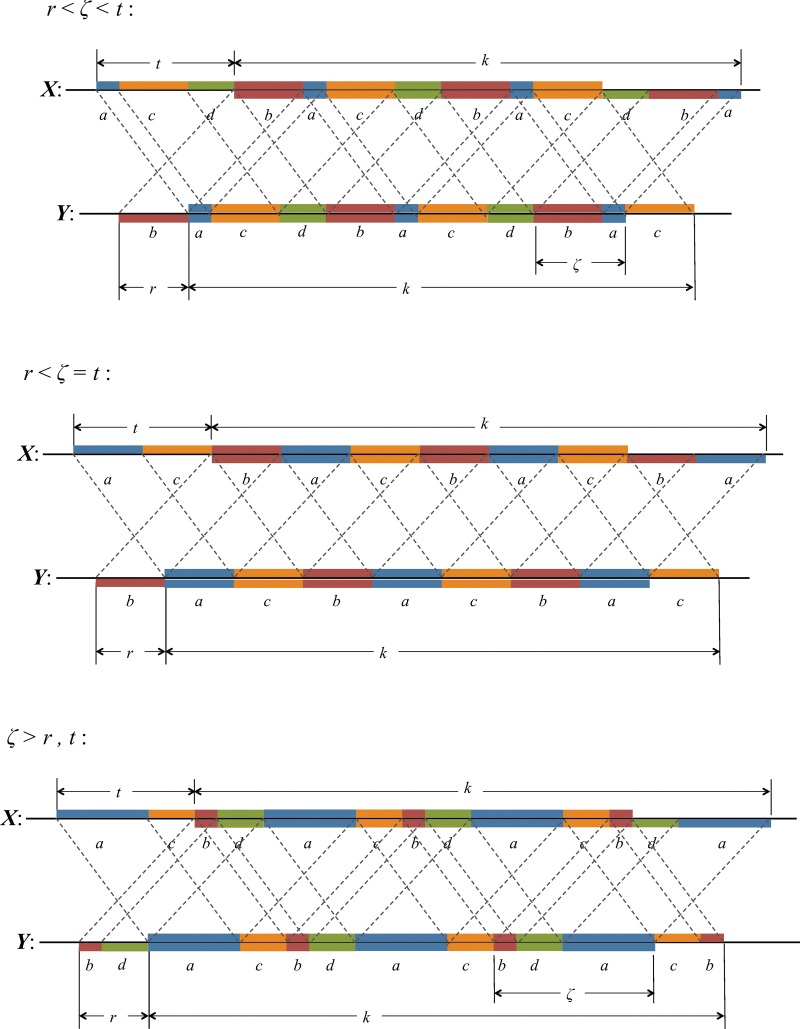
Word match counts have traditionally been proposed as an alignment-free measure of similarity for biological sequences. The D(2) statistic, which simply counts the number of exact word matches between two sequences, is a useful test bed for developing rigorous mathematical results, which can then be extended to more biologically useful measures. The distributional properties of the D(2) statistic under the null hypothesis of identically and independently distributed letters have been studied extensively, but no comprehensive study of the D(2) distribution for biologically more realistic higher-order Markovian sequences exists. Here we derive exact formulas for the mean and variance of the D(2) statistic for Markovian sequences of any order, and demonstrate through Monte Carlo simulations that the entire distribution is accurately characterized by a Pólya-Aeppli distribution for sequence lengths of biological interest. The approach is novel in that Markovian dependency is defined for sequences with periodic boundary conditions, and this enables exact analytic formulas for the mean and variance to be derived. We also carry out a preliminary comparison between the approximate D(2) distribution computed with the theoretical mean and variance under a Markovian hypothesis and an empirical D(2) distribution from the human genome.


Figures

<b>FIG. 1.</b>
FIG. 1.
Covering of the sequence X with θ-mers for the calculation of formula image (a) in the case where k ≥ θ, and (b) in the case where k < θ.
<b>FIG. 2.</b>
FIG. 2.
Contributions to Var(D2) via the sum in Equation (26). The left-hand diagram shows the (i′, j′)-plane for a fixed value of (i, j), shown as the black square. The right-hand diagram is an expanded view of the “accordion” region −k + 1 ≤ s, t ≤ k − 1, where t = i′ − i and s = j′ − j up to PBCs [see Equations (41) and (42)].
<b>FIG. 3.</b>
FIG. 3.
The exact distribution of the D2 statistic for short sequences of length m, n and words of length k from a Markov model of order θ and alphabet of size d. The Markov matrix M has been generated randomly in each case, and the exact distribution has been calculated by enumerating all dm+n possible sequence pairs. Also shown (dashed curve) is the cumulative distribution of the Pólya-Aeppli distribution with mean and variance set to the theoretical values using the formulas of Section 3.
<b>FIG. 4.</b>
FIG. 4.
Comparison of empirical cumulative distribution function for simulated D2 using Markov matrices for human chromosome 1 from Chor et al. (2009a,b), for orders θ = 0, 1, 2, and 3. 10,000 pairs per order, word length k = 8, alphabet size d = 4, sequence lengths m = n =1,000.
<b>FIG. 5.</b>
FIG. 5.
Comparison of Pólya-Aeppli, gamma, and normal cumulative distributions with empirical cumulative distribution function for simulated D2 using Markov order 3 matrix for human chromosome 1 from Chor et al. (2009a,b). 10,000 pairs, word length k = 8, sequence lengths m = n = 1,000.
<b>FIG. 6.</b>
FIG. 6.
Density of the empirical distribution of D2 from human chromosome 1 sample data from Ensembl compared with gamma distributions with calculated mean and variance, based on Markov models of various orders θ. 10,000 sample pairs, word length k = 8, and sequences lengths m = n = 1,000 (upper plot), word length k = 5 and sequences lengths m = n = 300 (lower plot).
<b>FIG. 7.</b>
FIG. 7.
Arrangements of word matches contributing to (a) nonoverlapping words, V0, (b) crabgrass V1, (c) accordions V2, V3, and (d) accordion V4. Images of words due to periodic boundary conditions are shown as a dashed outline.
<b>FIG. 8.</b>
FIG. 8.
Arrangements of word matches contributing to subcase 3(i) when ρ = (k − s) mod (t − s)> 0 (upper figure) and ρ = 0 (lower figure).
<b>FIG. 9.</b>
FIG. 9.
Arrangements of word matches contributing to V4 (first four cases).
<b>FIG. 10.</b>
FIG. 10.
Arrangements of word matches contributing to V4 (final three cases).

References

    1. Blaisdell B.1986. A measure of the similarity of sets of sequences not requiring sequence alignment. Proc. Natl. Acad. Sci. U.S.A. 83, 5155–5159 - PMC - PubMed
    1. Burden C.J., Kantorovitz M.R., and Wilson S.R.2008. Approximate word matches between two random sequences. Ann. Appl. Probab. 18, 1–21
    1. Burden C.J., Jing J., Forêt S., and Wilson S.R.2012. Application of k-word match statistics to the clustering of proteins with repeated domains. In Colubi A., Fokianos K., Kontoghiorghes E., and González-Rodríguez G., eds. Proceedings of COMPSTAT 2012, 20th International Conference on Computational Statistics 131–142
    1. Burden C.J., Jing J., and Wilson S.R.2012. Alignment-free sequence comparison for biologically realistic sequences of moderate length. Stat. Appl. Genet. Mol. Biol. 11, Article 3. - PubMed
    1. Chor B., Horn D., Goldman N., et al. . 2009a. Genomic DNA k-mer spectra: models and modalities. Genome Biol. 10, R108. - PMC - PubMed

Publication types

LinkOut - more resources