. 2013 Oct 26:10:314.
doi: 10.1186/1743-422X-10-314.

Comprehensive profiling of Epstein-Barr virus-encoded miRNA species associated with specific latency types in tumor cells

Affiliations

Comprehensive profiling of Epstein-Barr virus-encoded miRNA species associated with specific latency types in tumor cells

Hong-Jie Yang et al. Virol J. .

Abstract

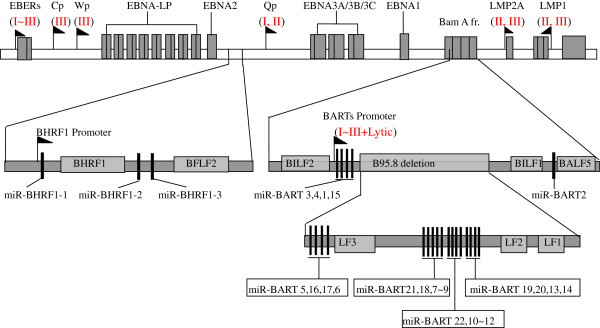
Background: Epstein-Barr virus (EBV) is an etiological cause of many human lymphocytic and epithelial malignancies. EBV expresses different genes that are associated with three latency types. To date, as many as 44 EBV-encoded miRNA species have been found, but their comprehensive profiles in the three types of latent infection that are associated with various types of tumors are not well documented.

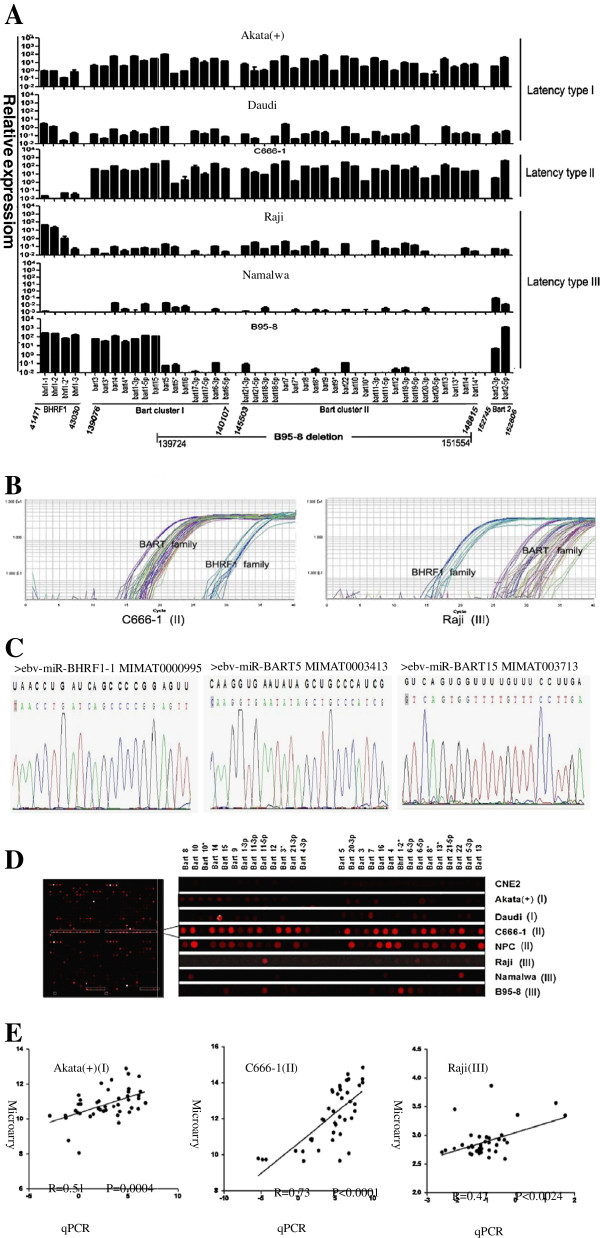
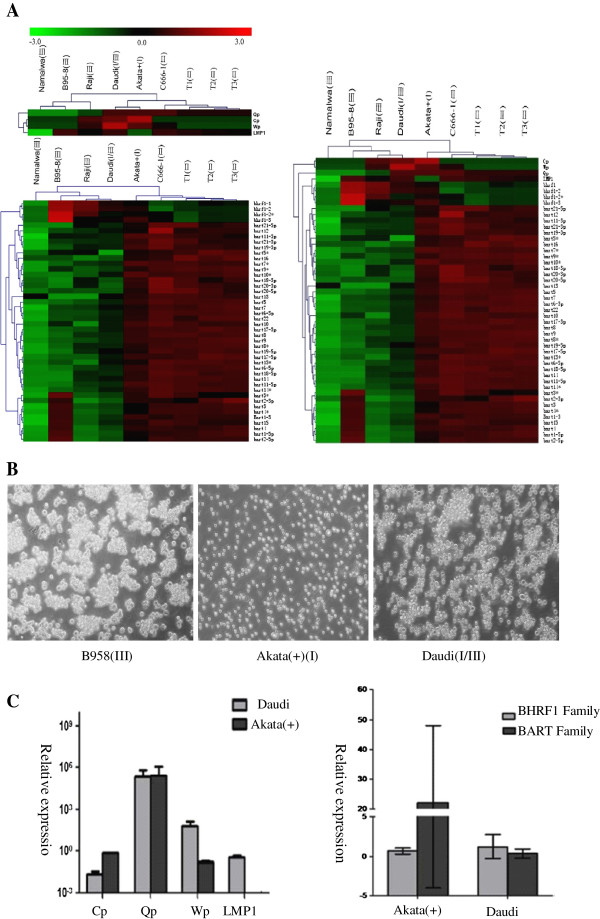
Methods: In the present study, we utilized poly (A)-tailed quantitative real-time RT-PCR in combination with microarray analysis to measure the relative abundances of viral miRNA species in a subset of representative lymphoid and epithelial tumor cells with various EBV latency types.

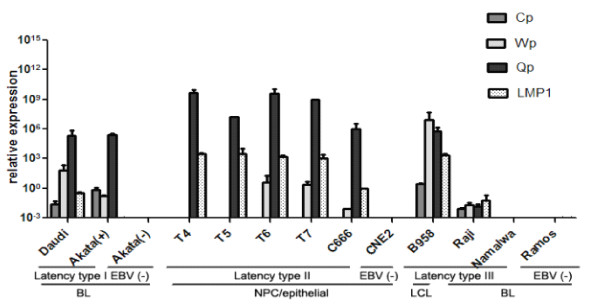
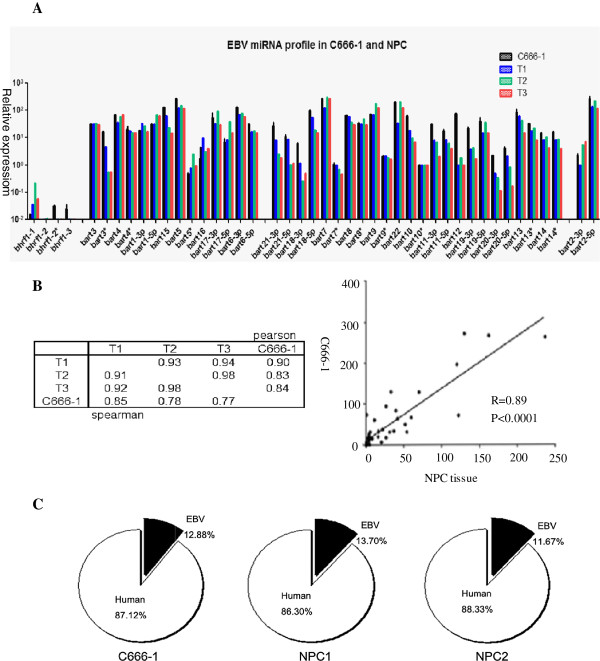
Results: Our findings showed that the miR-BHRF1 and miR-BART families were expressed differentially in a tissue- and latency type-dependent manner. Specifically, in nasopharyngeal carcinoma (NPC) tissues and the EBV-positive cell line C666-1, the miR-BART family accounted for more than 10% of all detected miRNAs, suggesting that these miRNAs have important roles in maintaining latent EBV infections and in driving NPC tumorigenesis. In addition, EBV miRNA-based clustering analysis clearly distinguished between the three distinct EBV latency types, and our results suggested that a switch from type I to type III latency might occur in the Daudi BL cell line.

Conclusions: Our data provide a comprehensive profiling of the EBV miRNA transcriptome that is associated with specific tumor cells in the three types of latent EBV infection states. EBV miRNA species represent a cluster of non-encoding latency biomarkers that are differentially expressed in tumor cells and may help to distinguish between the different latency types.


Figures

Figure 1
Figure 1
Genomic locations of all viral miRNA species. The top panel shows the position of latent genes and promoters (pennants). The middle panel shows the position of the EBV miRNAs, including the miR-BHRF1 and miR-BART families. The promoters of the BHRF1 and BART families are marked with pennants, and the EBV miRNA species whose genes are located within the deletion region in the prototype, B95-8-derived strain are shown in the lower panel. The locations of EBV miRNA genes are listed in genomic order from miRBase.
Figure 2
Figure 2
Characteristic expression patterns of EBV latency biomarkers for viral-coding genes. The levels of EBNA1 transcripts that were derived from promoters Q (Qp), C (Cp), and W (Wp) and the expression of LMP1 (latent membrane protein 1) were detected in cells having the three different EBV latency types by quantitative RT-PCR. Daudi and Akata(+) cells are EBV-positive BL (Burkitt’s lymphoma) cells with type I latency. T4, T5, T6 and T7 are pathologically confirmed, clinical NPC (nasopharyngeal carcinoma) specimens with EBV type II latency, and the C666-1 cell line is an epithelial NPC cell line that consistently harbors EBV. The Raji and Namalwa cell lines are EBV latency III BL cell lines, and the B95-8 cell line is a macaque lymphoblastoid cell line (LCL) harboring a prototype EBV strain. Akata(−), CNE2 and Ramos cells were used as EBV-negative controls, each qPCR reaction was run in triplicate, and the relative expression levels were calculated using the comparative method (2-ΔΔCt) with normalization to GAPDH.
Figure 3
Figure 3
Comprehensive and quantitative profiling of the EBV miRNA transcriptome in cells with the three latency types. (A) The comparable results from poly(A)-tailed, real-time RT-PCR analysis of the EBV-encoded miRNA transcriptome in the cell lines with latency I, II and III. The respective positions of the four clusters of EBV miRNAs (miR-BHRF1, miR-BART clusters I/II, miR-BART2 and the B95-8 deletion region) are marked below, and the numbers under the lines indicate the EBV genomic locations (nt). (B) Differential amplification curves of EBV miRNA species between epithelial and lymphoid tumor cells. The amplification curves of EBV miRNAs in C666-1 and Raji cells are separated distinctly into two parts: in epithelial C666-1 cells, the EBV BART family generally had lower Ct values than the BHRF1 family (left); and the opposite results were observed for the lymphoid Raji cells (right). (C) Verification of qPCR product specificity via DNA sequencing based on AT cloning. Representative DNA sequence results are shown for three, randomly selected qPCR products, the BHRF1 family member BHRF1-1 and two BART family members, Bart5 and Bart15. (D) An overview image from the microarray analysis of human miRNAs and EBV miRNAs in C666-1 cells (left). The right panel displays a subset of the hybridization signals for EBV miRNAs in the indicated region of the chips for tumor cell lines with various EBV latency types and including the EBV-negative cell line CNE2. (E) Correlation between the microarray read counts and the expression levels that were determined by real-time PCR of EBV miRNAs that were detected in cells with various latency types. The microarray and real-time PCR results were log2-transformed and analyzed using Person’s correlation analysis. Pearson’s correlation coefficients and p-values are shown in the inserts.
Figure 4
Figure 4
The pattern of the EBV miRNA transcriptome in NPC cells and tissues in the latency II state. (A) RT-PCR analysis of the EBV microRNA transcriptome in the persistently EBV-positive cell line C666-1 and three NPC tissue samples. U6 was used as an internal control. The whole EBV miRNAome is grouped into four clusters based on genomic location in sequential order. (B) Spearman and Pearson correlations between the C666-1 cells and the three NPC tissue samples (left). The expression levels of the EBV miRNAs were quantified by real-time RT-PCR. The data shown in the lower left portion are Pearson’s correlation coefficients, and the values shown in the upper right portion are Spearman’s correlation coefficients. To calculate the correlations, the real-time PCR results for the NPC tissues and C666-1 cells were log2-transformed and analyzed using Person’s correlation analysis. Pearson’s correlation coefficients and p-values are shown. The average expression level of each EBV miRNA species in the three NPC tissues is plotted on the x-axis (right). (C) Proportions of the respective human and EBV miRNA species that were detectable in C666-1 cells (left) and two NPC samples (middle and right) based on the microarray analysis. The EBV-encoded miRNAs accounted for more than 10% of the entire human miRNA library in the NPC samples in vivo and in vitro.
Figure 5
Figure 5
Clustering analysis of the EBV miRNA transcriptome helps to identify a latency switch. (A) Clustering analysis of the three latency types based on traditional EBV latency biomarkers (the EBNA1 promoters Cp, Wp, and Qp and LMP1) indicated that Daudi cells belonged to the EBV latency I group (upper left). However, unsupervised clustering analysis based on all of the EBV miRNA species alone (lower left) and in combination with classical latency biomarkers (right) suggested that Daudi cells might have undergone a transition from latency I to III. The three heat maps above were constructed based on normalized qPCR data. (B) Phenotypic observation of the Daudi cells in culture. Bright-field photomicrograph of three BL cell lines: B95-8 (left), Akata(+) (middle) and Daudi (right). The Daudi cells grew as macroscopic clumps, as was observed for the LCL B95-8 cells (the latency III control), whereas Akata(+) cells (latency I control) grew as a single-cell suspension. (C) Genotypic evaluation of the latency transition in Daudi cells. In contrast to Akata(+) cells, which exhibit latency I, Daudi cells had slightly higher levels of EBNA1 Wp activity and LMP1 expression (left). In addition, the average expression level of the BHRF1 family was slightly higher than that of the BART family in Daudi cells, which was in contrast to their patterns in Akata(+) cells (right).

Similar articles

Cited by

References

    1. Baumforth KR, Young LS, Flavell KJ, Constandinou C, Murray PG. The Epstein-Barr virus and its association with human cancers. Mol Pathol. 1999;52:307–322. doi: 10.1136/mp.52.6.307. - DOI - PMC - PubMed
    1. Niedobitek G. Epstein-Barr virus infection in the pathogenesis of nasopharyngeal carcinoma. Mol Pathol. 2000;53:248–254. doi: 10.1136/mp.53.5.248. - DOI - PMC - PubMed
    1. Pathmanathan R, Prasad U, Sadler R, Flynn K, Raab-Traub N. Clonal proliferations of cells infected with Epstein-Barr virus in preinvasive lesions related to nasopharyngeal carcinoma. N Engl J Med. 1995;333:693–698. doi: 10.1056/NEJM199509143331103. - DOI - PubMed
    1. Lo AK, Lo KW, Tsao SW, Wong HL, Hui JW, To KF, Hayward DS, Chui YL, Lau YL, Takada K, Huang DP. Epstein-Barr virus infection alters cellular signal cascades in human nasopharyngeal epithelial cells. Neoplasia. 2006;8:173–180. doi: 10.1593/neo.05625. - DOI - PMC - PubMed
    1. Lo AK, To KF, Lo KW, Lung RW, Hui JW, Liao G, Hayward SD. Modulation of LMP1 protein expression by EBV-encoded microRNAs. Proc Natl Acad Sci USA. 2007;104:16164–16169. doi: 10.1073/pnas.0702896104. - DOI - PMC - PubMed

Publication types

LinkOut - more resources