. 2014 Feb 7:342:15-22.
doi: 10.1016/j.jtbi.2013.10.006. Epub 2013 Oct 23.

Country- and age-specific optimal allocation of dengue vaccines

Affiliations

Country- and age-specific optimal allocation of dengue vaccines

Martial L Ndeffo Mbah et al. J Theor Biol. .

Abstract

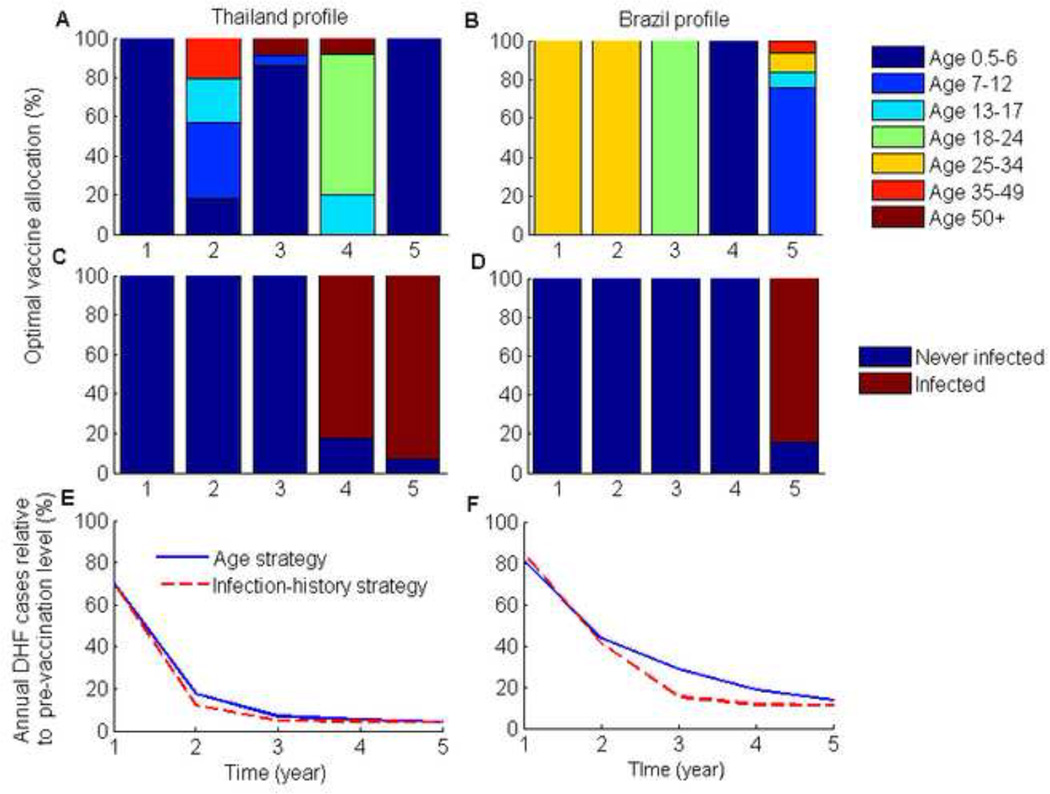
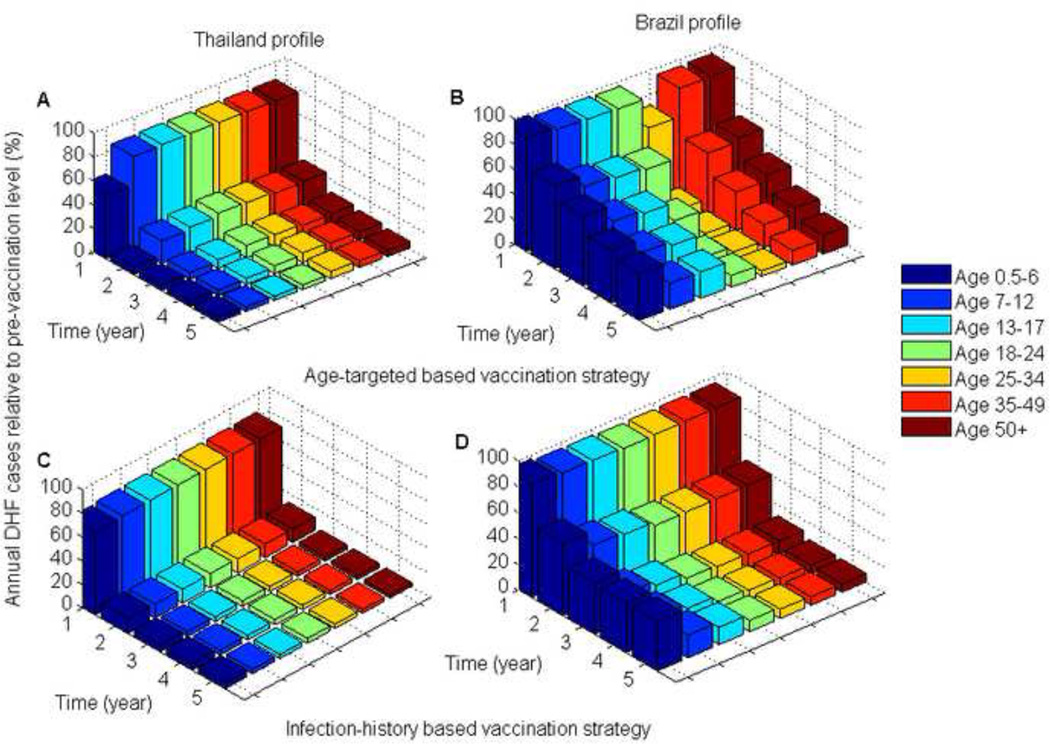
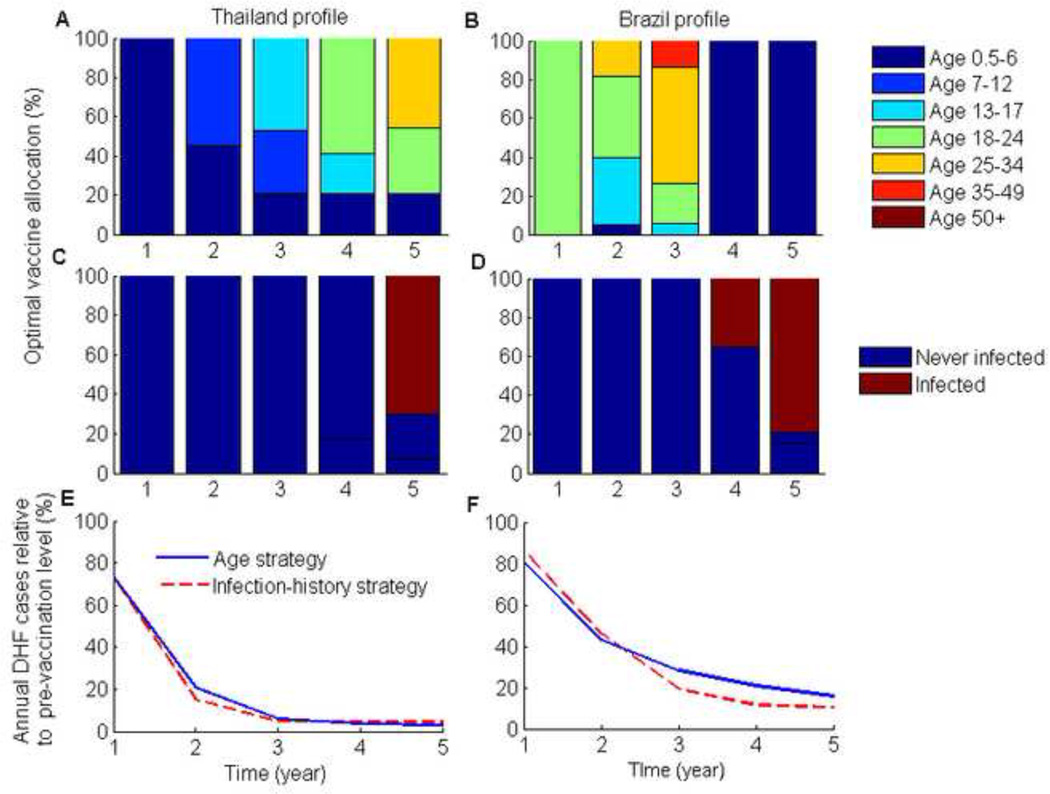
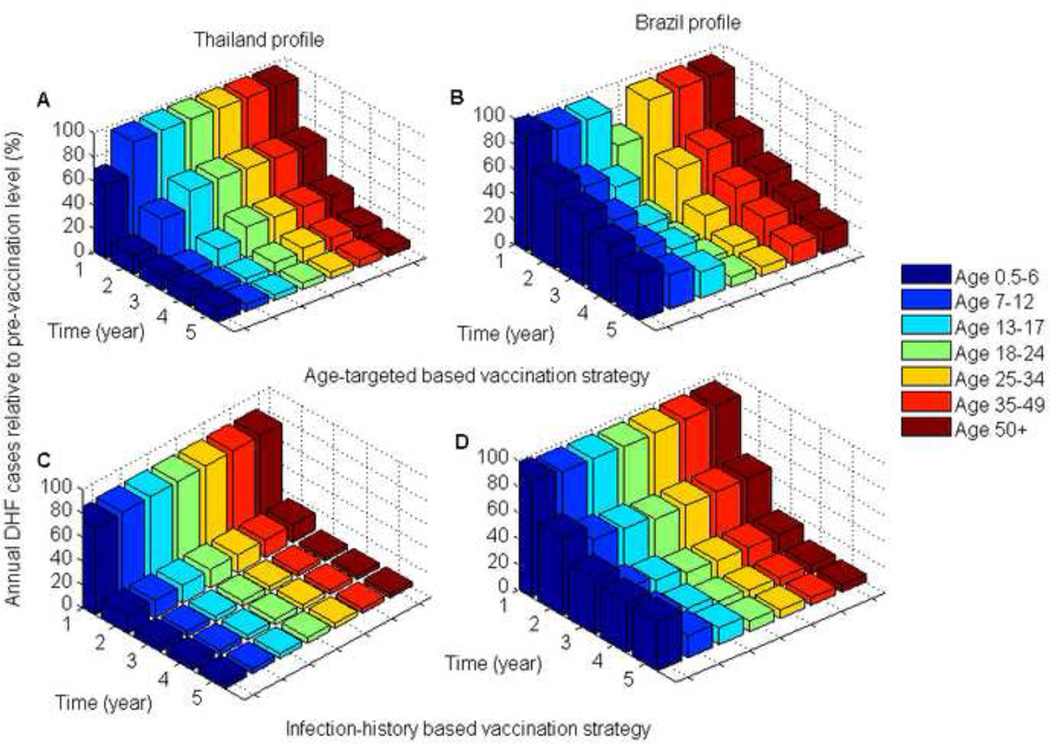
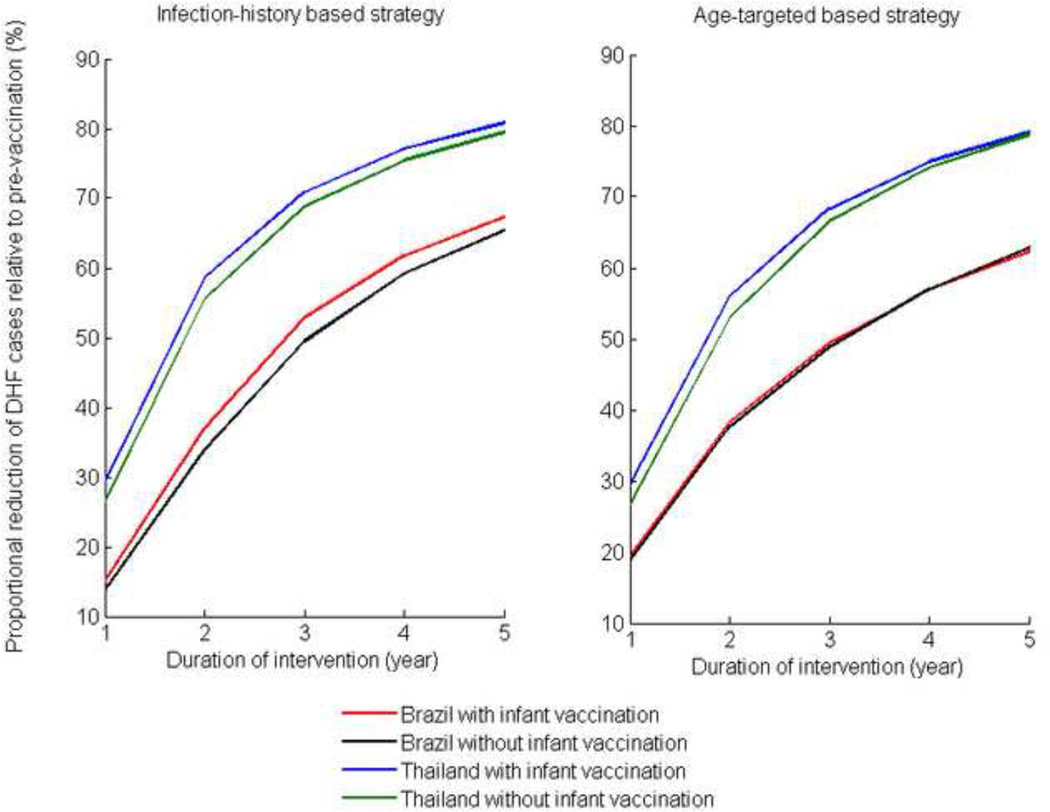
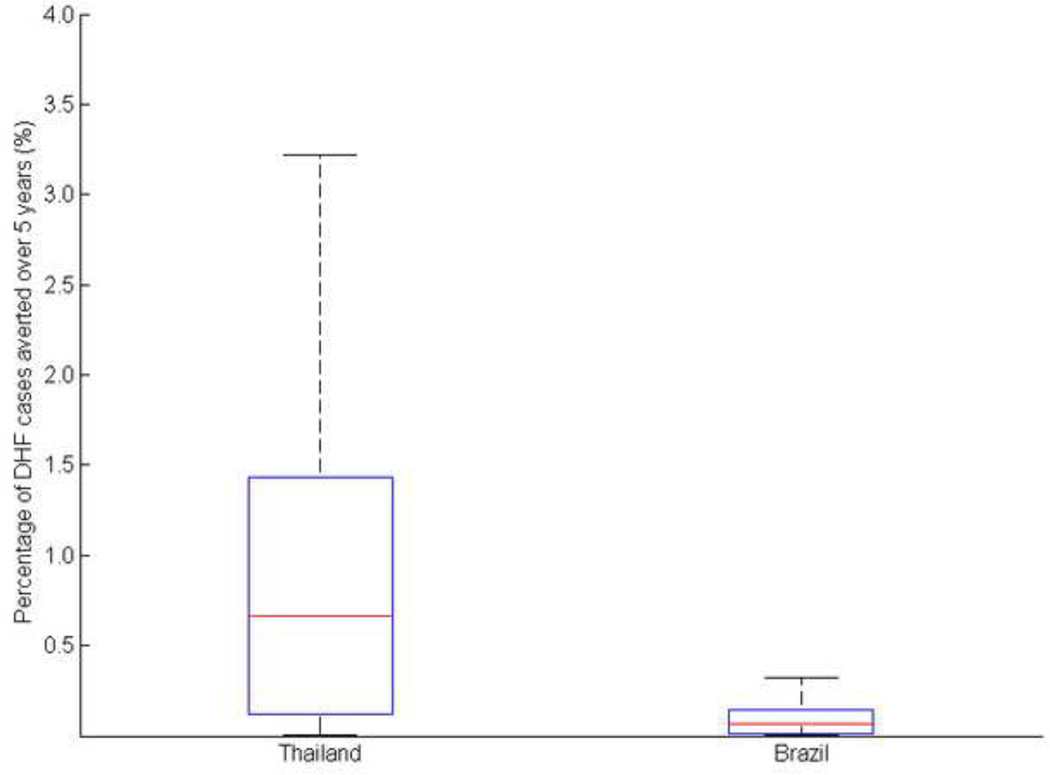
Several dengue vaccines are under development, and some are expected to become available imminently. Concomitant with the anticipated release of these vaccines, vaccine allocation strategies for dengue-endemic countries in Southeast Asia and Latin America are currently under development. We developed a model of dengue transmission that incorporates the age-specific distributions of dengue burden corresponding to those in Thailand and Brazil, respectively, to determine vaccine allocations that minimize the incidence of dengue hemorrhagic fever, taking into account limited availability of vaccine doses in the initial phase of production. We showed that optimal vaccine allocation strategies vary significantly with the demographic burden of dengue hemorrhagic fever. Consequently, the strategy that is optimal for one country may be sub-optimal for another country. More specifically, we showed that, during the first years following introduction of a dengue vaccine, it is optimal to target children for dengue mass vaccination in Thailand, whereas young adults should be targeted in Brazil.

Keywords: Dengue hemorrhagic fever; Dengue vaccine; Mathematical modeling; Optimization.


Figures

Figure 1
Figure 1. Optimal age- and infection-history- targeted vaccination strategies for a five-year intervention period with a 70% vaccination coverage of infants
(A,B) The proportion of each annual vaccine optimally allocated to each age group for the two DHF epidemiological profiles, and (C,D) the optimal infection-history vaccine allocation strategies. (E,F) The number of DHF cases each year for the optimal vaccination strategies relative to the pre-vaccination number of DHF cases. 70% infant vaccination coverage was the vaccination threshold for disease elimination over the long-term.
Figure 2
Figure 2. Comparison of DHF cases for the optimal vaccination strategies relative to pre-vaccination DHF cases for the two DHF epidemiological profiles
(A,B) The optimal age-targeted vaccination strategies; (C,D) The optimal infection-history-targeted vaccination strategies.
Figure 3
Figure 3. Optimal age- and infection-history-targeted vaccination strategies for a five-year intervention period with no infant vaccination
(A,B)The proportion of each annual vaccine optimally allocated to each age group for the two DHF epidemiological profiles, and (C,D) the optimal infection-history vaccine allocation strategies. (E,F) The number of DHF cases each year for the optimal vaccination strategies relative to the pre-vaccination number of DHF cases.
Figure 4
Figure 4. Comparison of DHF cases for the optimal vaccination strategies relative to pre-vaccination DHF cases for the two DHF epidemiological profiles
(A,B) The optimal age-targeted vaccination strategies; (C,D) The optimal infection-history targeted vaccination strategies.
Figure 5
Figure 5. Reduction of DHF cases for the optimal vaccination strategies relative to pre-vaccination DHF cases for the two DHF epidemiological profiles over the duration of the vaccination program
Figure 6
Figure 6. Comparison between the optimal age-targeted vaccination strategies derived from the base value with the optimal strategies obtained for different probabilities of mosquito-to-human transmission
The red line represents the median, while the lower and upper bound of the boxplot represent the first and third quartiles.

References

    1. Beatty ME, Beutels P, Meltzer MI, Shepard DS, Hombach J, Hutubessy R, et al. Health economics of dengue: A systematic literature review and expert panel's assessment. The American journal of tropical medicine and hygiene. 2011;84(3):473–488. - PMC - PubMed
    1. Suaya JA, Shepard DS, Siqueira JB, Martelli CT, Lum LCS, Tan LH, et al. Cost of dengue cases in eight countries in the Americas and Asia: a prospective study. The American journal of tropical medicine and hygiene. 2009;80(5):846–855. - PubMed
    1. Halstead SB. Dengue. The Lancet. 2007;370(9599):1644–1652. - PubMed
    1. Murrell S, Wu SC, Butler M. Review of dengue virus and the development of a vaccine. Biotechnology advances. 2011;29(2):239–247. - PubMed
    1. Srikiatkhachorn A, Gibbons RV, Green S, Libraty DH, Thomas SJ, Endy TP, et al. Dengue Hemorrhagic Fever: The Sensitivity and Specificity of the World Health Organization Definition for Identification of Severe Cases of Dengue in Thailand, 1994–2005. Clinical Infectious Diseases. 2010 Apr 15;50(8):1135–1143. 2010. - PMC - PubMed

Substances