Optimod--an automated approach for constructing and optimizing initial models for single-particle electron microscopy
- PMID: 24161732
- PMCID: PMC3885246
- DOI: 10.1016/j.jsb.2013.10.009
Optimod--an automated approach for constructing and optimizing initial models for single-particle electron microscopy
Abstract
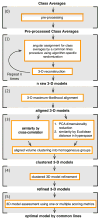
Single-particle cryo-electron microscopy is now well established as a technique for the structural characterization of large macromolecules and macromolecular complexes. The raw data is very noisy and consists of two-dimensional projections, from which the 3D biological object must be reconstructed. The 3D object depends upon knowledge of proper angular orientations assigned to the 2D projection images. Numerous algorithms have been developed for determining relative angular orientations between 2D images, but the transition from 2D to 3D remains challenging and can result in erroneous and conflicting results. Here we describe a general, automated procedure, called OptiMod, for reconstructing and optimizing 3D models using common-lines methodologies. OptiMod approximates orientation angles and reconstructs independent maps from 2D class averages. It then iterates the procedure, while considering each map as a raw solution that needs to be compared with other possible outcomes. We incorporate procedures for 3D alignment, clustering, and refinement to optimize each map, as well as standard scoring metrics to facilitate the selection of the optimal model. We also show that small angle tilt-pair data can be included as one of the scoring metrics to improve the selection of the optimal initial model, and also to provide a validation check. The overall approach is demonstrated using two experimental cryo-EM data sets--the 80S ribosome that represents a relatively straightforward case for ab initio reconstruction, and the Tf-TfR complex that represents a challenging case in that it has previously been shown to provide multiple equally plausible solutions to the initial model problem.
Keywords: Automation; Common-lines; Initial model; Single-particle electron microscopy.
Copyright © 2013 Elsevier Inc. All rights reserved.
Figures


Similar articles
-
A Fast Image Alignment Approach for 2D Classification of Cryo-EM Images Using Spectral Clustering.Curr Issues Mol Biol. 2021 Oct 18;43(3):1652-1668. doi: 10.3390/cimb43030117. Curr Issues Mol Biol. 2021. PMID: 34698131 Free PMC article.
-
Auto3DCryoMap: an automated particle alignment approach for 3D cryo-EM density map reconstruction.BMC Bioinformatics. 2020 Dec 28;21(Suppl 21):534. doi: 10.1186/s12859-020-03885-9. BMC Bioinformatics. 2020. PMID: 33371884 Free PMC article.
-
IPET and FETR: experimental approach for studying molecular structure dynamics by cryo-electron tomography of a single-molecule structure.PLoS One. 2012;7(1):e30249. doi: 10.1371/journal.pone.0030249. Epub 2012 Jan 24. PLoS One. 2012. PMID: 22291925 Free PMC article.
-
Determining the structure of biological macromolecules by transmission electron microscopy, single particle analysis and 3D reconstruction.Prog Biophys Mol Biol. 2001;75(3):121-64. doi: 10.1016/s0079-6107(01)00004-9. Prog Biophys Mol Biol. 2001. PMID: 11376797 Review.
-
Fundamentals of three-dimensional reconstruction from projections.Methods Enzymol. 2010;482:1-33. doi: 10.1016/S0076-6879(10)82001-4. Methods Enzymol. 2010. PMID: 20888956 Free PMC article. Review.
Cited by
-
Addressing preferred specimen orientation in single-particle cryo-EM through tilting.Nat Methods. 2017 Aug;14(8):793-796. doi: 10.1038/nmeth.4347. Epub 2017 Jul 3. Nat Methods. 2017. PMID: 28671674 Free PMC article.
-
A combined quantitative mass spectrometry and electron microscopy analysis of ribosomal 30S subunit assembly in E. coli.Elife. 2014 Oct 14;3:e04491. doi: 10.7554/eLife.04491. Elife. 2014. PMID: 25313868 Free PMC article.
-
Modular Assembly of the Bacterial Large Ribosomal Subunit.Cell. 2016 Dec 1;167(6):1610-1622.e15. doi: 10.1016/j.cell.2016.11.020. Cell. 2016. PMID: 27912064 Free PMC article.
-
Glycan shield and epitope masking of a coronavirus spike protein observed by cryo-electron microscopy.Nat Struct Mol Biol. 2016 Oct;23(10):899-905. doi: 10.1038/nsmb.3293. Epub 2016 Sep 12. Nat Struct Mol Biol. 2016. PMID: 27617430 Free PMC article.
-
Cryo-EM structures and atomic model of the HIV-1 strand transfer complex intasome.Science. 2017 Jan 6;355(6320):89-92. doi: 10.1126/science.aah5163. Science. 2017. PMID: 28059769 Free PMC article.
References
Publication types
MeSH terms
Substances
Grants and funding
LinkOut - more resources
Full Text Sources
Other Literature Sources
Miscellaneous

