. 2013 Nov;4(11):1986-98.
doi: 10.18632/oncotarget.1420.

Mitochondrial oxidative stress is the Achille's heel of melanoma cells resistant to Braf-mutant inhibitor

Affiliations

Mitochondrial oxidative stress is the Achille's heel of melanoma cells resistant to Braf-mutant inhibitor

Paola Corazao-Rozas et al. Oncotarget. 2013 Nov.

Abstract

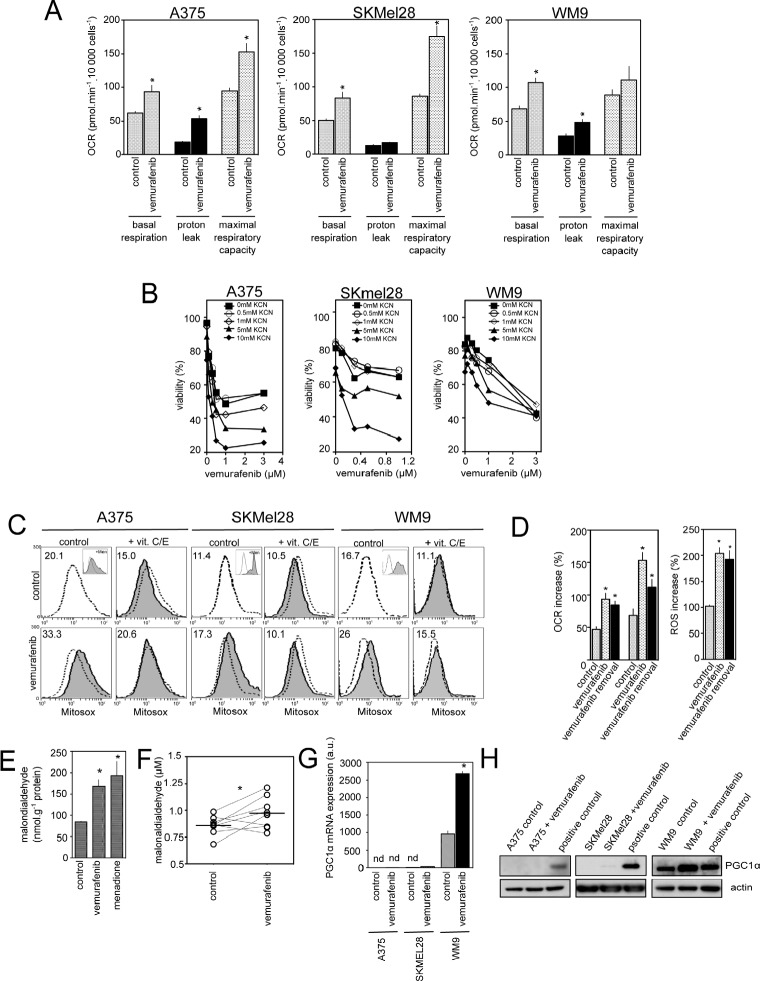
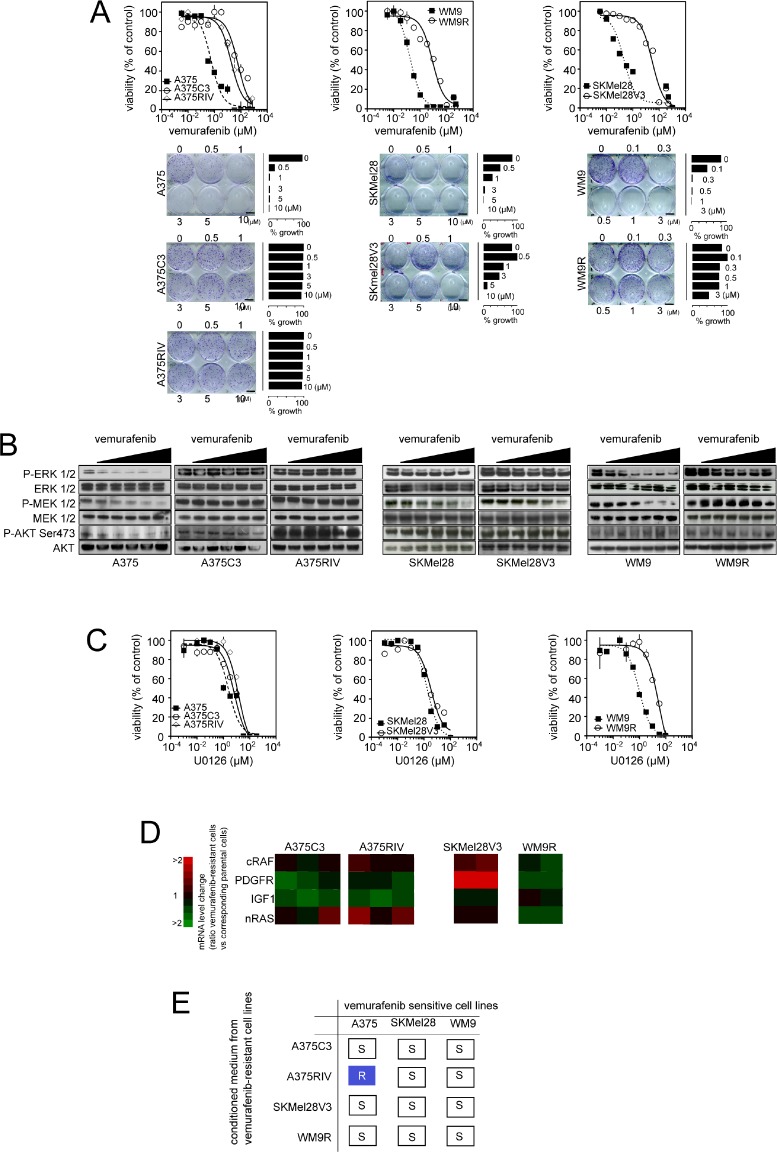
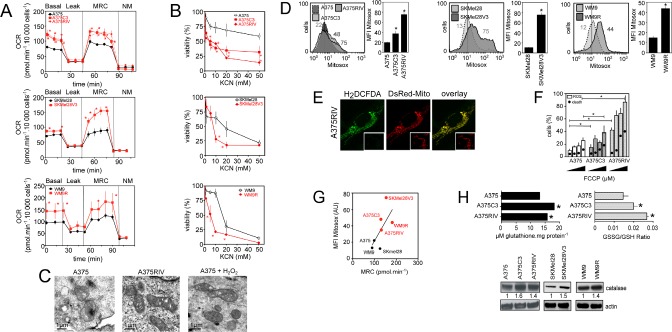
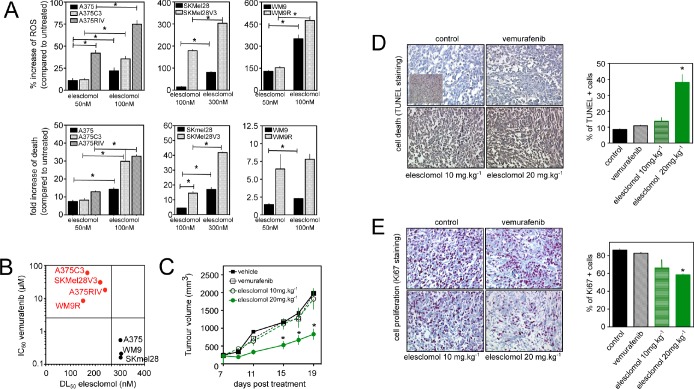
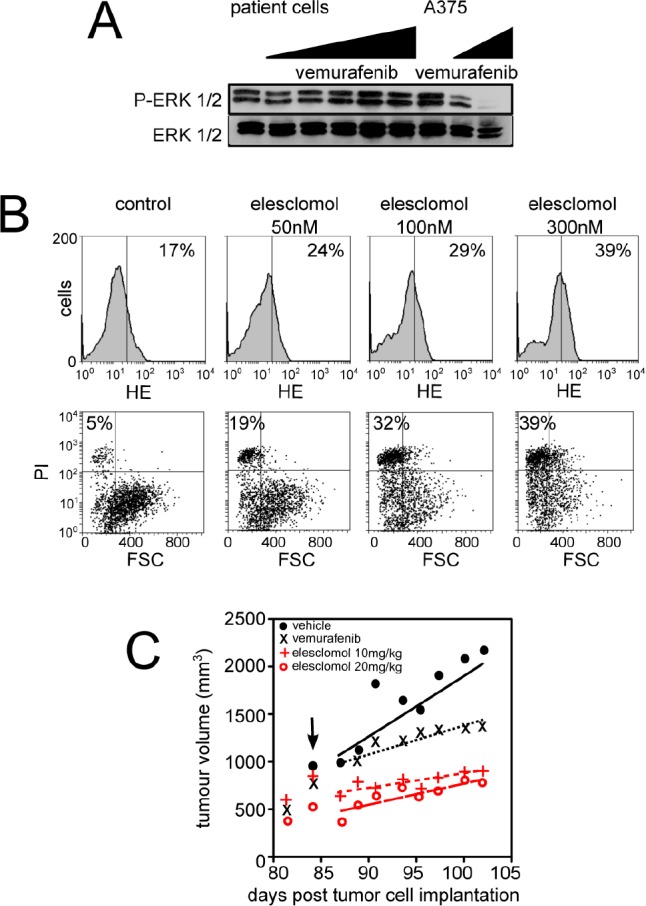
Vemurafenib/PLX4032, a selective inhibitor of mutant BRAFV600E, constitutes a paradigm shift in melanoma therapy. Unfortunately, acquired resistance, which unavoidably occurs, represents one major limitation to clinical responses. Recent studies have highlighted that vemurafenib activated oxidative metabolism in BRAFV600E melanomas expressing PGC1α. However, the oxidative state of melanoma resistant to BRAF inhibitors is unknown. We established representative in vitro and in vivo models of human melanoma resistant to vemurafenib including primary specimens derived from melanoma patients. Firstly, our study reveals that vemurafenib increased mitochondrial respiration and ROS production in BRAFV600E melanoma cell lines regardless the expression of PGC1α. Secondly, melanoma cells that have acquired resistance to vemurafenib displayed intrinsically high rates of mitochondrial respiration associated with elevated mitochondrial oxidative stress irrespective of the presence of vemurafenib. Thirdly, the elevated ROS level rendered vemurafenib-resistant melanoma cells prone to cell death induced by pro-oxidants including the clinical trial drug, elesclomol. Based on these observations, we propose that the mitochondrial oxidative signature of resistant melanoma constitutes a novel opportunity to overcome resistance to BRAF inhibition.


Conflict of interest statement

Dr. Ariel Savina is employed by Roche SAS, which provided a support to this work. Vemurafenib was synthesized by Roche SAS.

Figures

Figure 1
Figure 1. Effect of vemurafenib on mitochondrial oxidative metabolism in PGC1α positive and negative melanoma cell lines
(A) Comparison of respiratory states (basal respiration, proton leak, maximum respiratory capacity) in melanoma cells (A375, SKMel28 and WM9) in the absence (control) or presence of vemurafenib (3μM for 24h) (see Material and Methods) *P<0.05 compared to control; (B) Viability of melanoma cells exposed to mitochondrial inhibitors KCN (0.5 to 2mM). Cell viability was estimated by PI after 72 h of treatment (mean+/−SD of three independent experiments); (C) Mitochondrial ROS production in melanoma cells exposed to vemurafenib. Representative flow cytometric profiles of melanoma cells exposed to 3μM vemurafenib in the presence or absence of 100 μM Vitamin C and E for 24 h. Cells were then stained with MitoSox before analysis. As positive control, cells were treated with 100μM menadione for 90 min (inset). Dashed line: fluorescence of control (untreated) cells. Numbers are the mean MitoSox fluorescence intensity values. Data represent typical results of one out of five independent experiments; (D) A375 cells were either kept untreated (control), treated with vemurafenib for 24h (vemurafenib), or exposed to vemurafenib for 24 h then washed and maintained for additional 24 h without vemurafenib (vemurafenib + withdrawal) before proceeding to determination of oxygen consumption (left) and ROS production (right). Data are means+/−SD of two experiments in duplicates. *P<0.05 compared to control (E) MDA levels were determined in A375 cells exposed to vemurafenib or kept untreated (control). As positive control of lipid peroxidation, cells were exposed to menadione as above. Data are means+/−SD of four independent experiments. *P<0.05 compared to control; (F) MDA levels were evaluated in blood plasma of 8 patients with BRAFV600E melanomas before vemurafenib and after 30 days of treatment. Horizontal lines are median values. *P<0.05 compared to control; (G) A375, SKMel28 or WM9 were exposed to 3μM vemurafenib for 24 h then total RNA were subjected to Q-RTPCR to quantify PGC1α mRNA abundance. Results are mean+/−SD of three independent experiments. Nd stands for not detectable. *P<0.05 compared to control; (H) Immunoblotting of PGC1α expression in melanoma cells treated with vemurafenib as in (G). Actin served as loading control.
Figure 2
Figure 2. Generation of melanoma models of vemurafenib acquired resistance mediated through diverse mechanisms
(A) Upper panel: Parental and vemurafenib-resistant cell lines were treated with increasing concentrations of vemurafenib (3 nmol/l to 750 μmol/l) for 3 days before the assessment of cell growth by MTS assay; lower panel: Colony-forming ability of A375, A375/C3 and A375/RIV treated with indicated doses of vemurafenib for 10 days. Photographs and relative quantification are representative of one experiment made in triplicates; (B) Effects of vemurafenib exposure (for 6 h, at the following doses: 100 nM, 300 nM, 500 nM, 1 μM, 3 μM and when indicated 5 μM) on the MAPK signaling cascade were evaluated by western blotting; (C) Parental and vemurafenib-resistant cell lines were treated with increasing concentrations of the MEK inhibitor, U0126, (1 nmol/l to 333 μmol/l) for 3 days before the assessment of cell growth by MTS assay; (D) Comparison of mRNA expression of N-Ras, C-Raf, IGF-1R, PDGFRβ between parental and vemurafenib-resistant melanomas; (E) Transmission of vemurafenib resistance from resistant to parental cells incubated for 4 h in conditioned medium from resistant sublines then treated for 72 h with 5 μmol/l vemurafenib before assessment of viability by flow cytometry. Summary of 3 independent experiments R : Resistance and S : sensitive.
Figure 3
Figure 3. Mitochondrial oxidative stress in vemurafenib resistant cells
(A) Oxygen consumption rate (OCR pmol/min) in vemurafenib resistant melanoma cell lines in comparison to parental cells. The different states of mitochondrial respiration are indicated: basal respiration (Basal), proton leak (respiration after oligomycin exposure), maximal respiratory capacity (respiration after FCCP, MRC), non-mitochondrial respiration (after rotenone and antimycin A) (NM). *P<0.05 compared to control; (B) Effect of inhibition of respiration on viability of parental and vemurafenib-resistant cells; Cells were exposed to indicated doses of KCN for 24 h then viability was assessed by flow cytometry after PI staining. *P<0.05 compared to control (C) Morphology of mitochondria in A375 and A375RIV cells by transmission electron microscopy. As a control, A375 cells were treated with 500 μmol/l H2O2 for 1h. Scale bar: 1 μm; (D) Mitochondrial ROS production in parental and vemurafenib-resistant cell lines. Representative flow cytometric profiles (left) and histogram (right, mena +/−SD) of five independent experiments. Cells were then stained with MitoSox before analysis. *P<0.05 compared to control; (E) H2DCFDA staining (green) co-localizes with DsRed-labelled mitochondria (red) in A375RIV cells. Typical fluorescence images of one experiment. (Inset) DsRed-labelled mitochondria without H2DCFDA staining; (F) Effects of FCCP (2, 5, 10 μM) on ROS production and cell death on A375 and A375C3, A375 RIV. Cells were treated for 6h before ROS determination by flow cytometry as described above and for 48 h before assessment of cell death by PI staining. (Results are means +/−SD from 3 independent experiments). *P<0.05 compared to control; (G) Correlation between mitochondrial activity (MRC) and ROS production (MFI MitoSox values) in several human melanoma cell lines; (H) Determination of the antioxidant status in A375 and A375 C3, A375 RIV cells. (upper panel) determination of total glutathione and GSSG/GSH ratio as described in Materials and methods. Data are means +/− SD of three independent experiments. *P<0.05 compared to control; (lower panel) Expression of catalase analysed by immunoblotting. Actin served as loading control. Representative images of three independent experiments. Mean values obtained from densitometric measures and normalized to the actin values are represented.
Figure 4
Figure 4. Effects of the pro-oxidant elesclomol on vemurafenib-resistant melanoma cells
(A) ROS generation (determined by flow cytometry, upper panel) and cell death (determined by PI staining lower panel) induced by elesclomol at the indicated doses for 6h in A375, A375C3 and A375RIV cell lines and for 3h in other melanoma cell lines. Data are means +/− SD of two independent experiments made in duplicates. *P<0.05 compared to control; (B) Scatterplot melanoma cell lines of the sensitivity toward vemurafenib (determination of IC50 values after 72h of treatment) and elesclomol (determinion of DL 50 values after 6h of treatement); (C) In vivo efficacy of elesclomol in tumor-bearing mice. A375C3 cells were injected into the right flank of SCID mice. Mice were treated either with vemurafenib 75mg/kg seven days a week by oral gavage or with elesclomol 10mg/kg or 20mg/kg i.v. Tumour volume was measured at the indicated times. Data represent means +/−SD from 6 to 10 mice per group. *P<0.05 compared to control. Histological sections from tumor-bearing mice were labelled with an anti-Ki67 antibody (D) to detect cell proliferation and by TUNEL assay (E) to assess cell death (mean+/−SD, n=3, *P<0.05 compared to control).
Figure 5
Figure 5. Effects of elesclomol on primary melanoma cells from patient resistant to vemurafenib
(A) Western blot analysis of the effects of vemurafenib exposure (for 6h at increasing doses) on ERK phosphorylation in melanoma cells derived from one patient with acquired resistance to vemurafenib. A375 cells were also used as control; (B) Effect of elesclomol on ROS production (upper panel) and cell death (lower panel) in melanoma cells derived from one patient with acquired resistance to vemurafenib; (C) Graph representating growth of tumor xenograft from the same patient than in B. Tumor xenografts were treated (black arrow) following the above protocol.

References

    1. Dong J, Phelps RG, Qiao R, Yao S, Benard O, Ronai Z, Aaronson SA. BRAF oncogenic mutations correlate with progression rather than initiation of human melanoma. Cancer Res. 2003;63:3883–5. - PubMed
    1. Falchook GS, Trent JC, Heinrich MC, Beadling C, Patterson J, Bastida CC, Blackman SC, Kurzrock R. BRAF mutant gastrointestinal stromal tumor: first report of regression with BRAF inhibitor dabrafenib (GSK2118436) and whole exomic sequencing for analysis of acquired resistance. Oncotarget. 2013;4:310–5. - PMC - PubMed
    1. Nucera C, Lawler J, Hodin R, Parangi S. The BRAFV600E mutation: what is it really orchestrating in thyroid cancer? Oncotarget. 2010;1:751–6. - PMC - PubMed
    1. Chapman PB, Hauschild A, Robert C, Haanen JB, Ascierto P, Larkin J, Dummer R, Garbe C, Testori A, Maio M, Hogg D, Lorigan P, Lebbe C, Jouary T, Schadendorf D, Ribas A, et al. Improved survival with vemurafenib in melanoma with BRAF V600E mutation. N. Engl. J. Med. 2011;364:2507–16. - PMC - PubMed
    1. Sosman JA, Kim KB, Schuchter L, Gonzalez R, Pavlick AC, Weber JS, McArthur GA, Hutson TE, Moschos SJ, Flaherty KT, Hersey P, Kefford R, Lawrence D, Puzanov I, Lewis KD, Amaravadi RK, et al. Survival in BRAF V600-mutant advanced melanoma treated with vemurafenib. N. Engl. J. Med. 2012;366:707–14. - PMC - PubMed

Publication types

MeSH terms