. 2014 Feb;24(2):340-8.
doi: 10.1101/gr.160325.113. Epub 2013 Oct 25.

Improved exome prioritization of disease genes through cross-species phenotype comparison

Affiliations

Improved exome prioritization of disease genes through cross-species phenotype comparison

Peter N Robinson et al. Genome Res. 2014 Feb.

Abstract

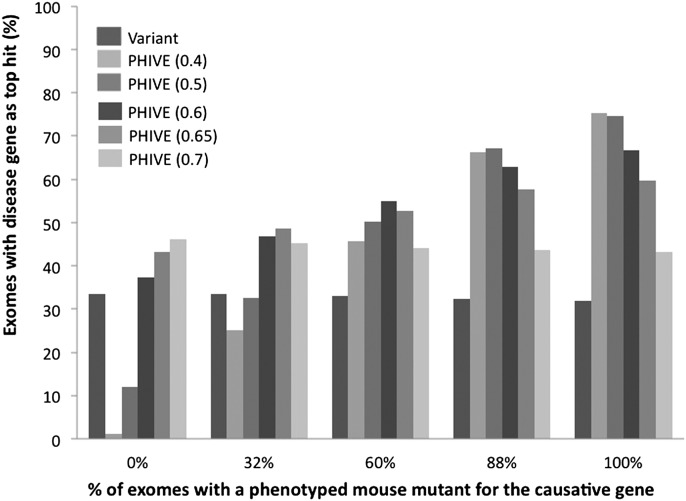
Numerous new disease-gene associations have been identified by whole-exome sequencing studies in the last few years. However, many cases remain unsolved due to the sheer number of candidate variants remaining after common filtering strategies such as removing low quality and common variants and those deemed unlikely to be pathogenic. The observation that each of our genomes contains about 100 genuine loss-of-function variants makes identification of the causative mutation problematic when using these strategies alone. We propose using the wealth of genotype to phenotype data that already exists from model organism studies to assess the potential impact of these exome variants. Here, we introduce PHenotypic Interpretation of Variants in Exomes (PHIVE), an algorithm that integrates the calculation of phenotype similarity between human diseases and genetically modified mouse models with evaluation of the variants according to allele frequency, pathogenicity, and mode of inheritance approaches in our Exomiser tool. Large-scale validation of PHIVE analysis using 100,000 exomes containing known mutations demonstrated a substantial improvement (up to 54.1-fold) over purely variant-based (frequency and pathogenicity) methods with the correct gene recalled as the top hit in up to 83% of samples, corresponding to an area under the ROC curve of >95%. We conclude that incorporation of phenotype data can play a vital role in translational bioinformatics and propose that exome sequencing projects should systematically capture clinical phenotypes to take advantage of the strategy presented here.


Figures

Figure 1.
Figure 1.
Exomiser filters a whole-exome data set by removing off-target, common, and synonymous variants from further consideration and evaluates the remaining variants based on the predicted pathogenicity and minor allele frequency (variant score). Optionally, an assumed mode of inheritance is used to further filter genes with variants present in a pattern compatible with the assumed mode of inheritance (e.g., homozygous or compound heterozygous for autosomal recessive). These genes are then assigned a phenotypic relevance score based on comparison with 28,176 mouse models with mutations in 9043 genes (7270 protein coding). The final ranking is calculated as the sum of the individual scores to yield the PHIVE score.
Figure 2.
Figure 2.
Phenotype matching algorithm. The user enters a human phenotype, either as an OMIM disease or as a list of HPO terms. All genes with variants that survive the initial filtering steps are then screened for mouse models with phenotypic similarity to the human disease. Similarity is calculated based on the semantic similarity of individual phenotypic features as described previously (Smedley et al. 2013).
Figure 3.
Figure 3.
Exomiser querying of an exome containing a known chr10:g.123256215T>G heterozygous mutation associated with Pfeiffer syndrome (MIM:101600), an autosomal dominant Mendelian disease. The tab “Prioritised gene/variant list” shows the PHIVE prioritization of the 308 genes remaining after filtering of the original 8388 (details in Filtering summary table). The fully annotated variants associated with each gene, including pathogenicity and minor allele frequency, are shown along with the phenotypic relevance score from PhenoDigm and links out to any known phenotypic annotation from MGI/MGP or OMIM. The known variant is the top hit and annotated as a pathogenic, Glu to Ala missense coding change in FGFR2.
Figure 4.
Figure 4.
Comparison of different Exomiser filtering and prioritization strategies, including frequency data from either the ESP and the 1000 Genomes Project (A), or only ESP (B) to remove any potential bias due to the noncausative variants also coming from the 1000 Genomes Project. The first four groups of results show filtering of exomes (mean genes before filtering = 8388) by (1) removal of common, synonymous, and noncoding variants (mean genes after filtering = 400; 98.1% of disease variants retained) for All diseases, (2) further restriction to those compatible with Autosomal dominant (mean genes after filtering = 379; 98.5% of disease variants retained), or (3) Autosomal recessive inheritance by either homozygous or compound heterozygous mutation (mean genes after filtering = 37; 97.8% of disease variants retained). The performance for all diseases is also broken down into nonsense and missense mutations. In addition, we show the performance for all diseases in which the associated gene was discovered in 2011 or 2012 and the performance in which a random set of disease phenotype annotations were used rather than those of the disease being tested. Finally, the performance when adding known disease mutations to 144 exome samples from our own center rather than the 1000 Genomes Project exomes is shown. The bars show the percentage of times in which the true disease gene was assigned the top ranking match in 100,000 simulated WES data sets per analysis after prioritization based on the PHIVE score, variant score, and phenotypic relevance score.
Figure 5.
Figure 5.
Comparison of different default phenotypic relevance scores for variants where no phenotyped mouse model exists for the gene containing the variant. The individual groups show the results after filtering to remove common, synonymous, and noncoding variants for exomes in which either 0, 32%, 60%, 88%, or 100% of the simulated exomes have a causative variant with mouse phenotype data for the orthologous gene. Thirty-two percent represents the current coverage of human protein-coding genes by phenotype data for the mouse ortholog. Eighty-eight percent represents the phenotypic coverage of disease-associated genes from the HGMD data set used throughout our studies. The bars show the percentage of times in which the true disease gene was assigned the top scoring match in 100,000 simulated WES data sets per analysis after prioritization based on either the variant score or PHIVE score using default phenotypic relevance scores of 0.4, 0.5, 0.6, 0.65, or 0.7.

References

    1. The 1000 Genomes Project Consortium 2012. An integrated map of genetic variation from 1,092 human genomes. Nature 491: 56–65 - PMC - PubMed
    1. Adzhubei IA, Schmidt S, Peshkin L, Ramensky VE, Gerasimova A, Bork P, Kondrashov AS, Sunyaev SR 2010. A method and server for predicting damaging missense mutations. Nat Methods 7: 248–249 - PMC - PubMed
    1. Aerts S, Lambrechts D, Maity S, Van Loo P, Coessens B, De Smet F, Tranchevent LC, De Moor B, Marynen P, Hassan B, et al. 2006. Gene prioritization through genomic data fusion. Nat Biotechnol 24: 537–544 - PubMed
    1. Amberger J, Bocchini C, Hamosh A 2011. A new face and new challenges for Online Mendelian Inheritance in Man (OMIM®). Hum Mutat 32: 564–567 - PubMed
    1. Ayadi A, Birling MC, Bottomley J, Bussell J, Fuchs H, Fray M, Gailus-Durner V, Greenaway S, Houghton R, Karp N, et al. 2012. Mouse large-scale phenotyping initiatives: Overview of the European Mouse Disease Clinic (EUMODIC) and of the Wellcome Trust Sanger Institute Mouse Genetics Project. Mamm Genome 23: 600–610 - PMC - PubMed

Publication types