. 2013 Dec;14(12):1285-93.
doi: 10.1038/ni.2745. Epub 2013 Oct 27.

Transcriptional downregulation of S1pr1 is required for the establishment of resident memory CD8+ T cells

Affiliations

Transcriptional downregulation of S1pr1 is required for the establishment of resident memory CD8+ T cells

Cara N Skon et al. Nat Immunol. 2013 Dec.

Abstract

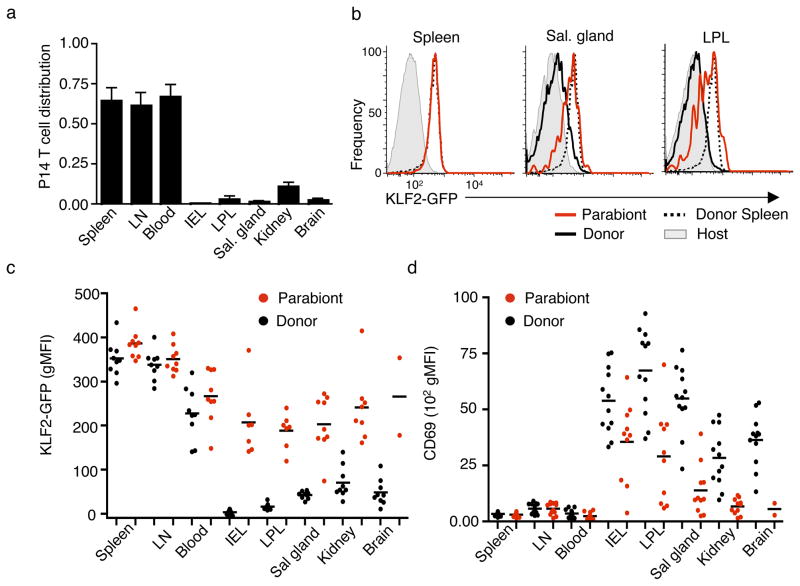
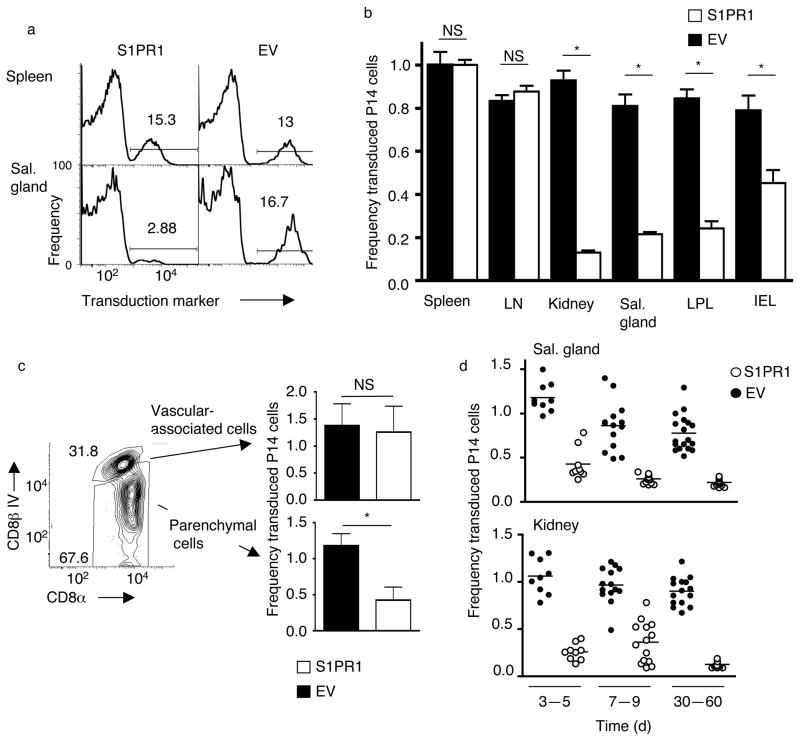
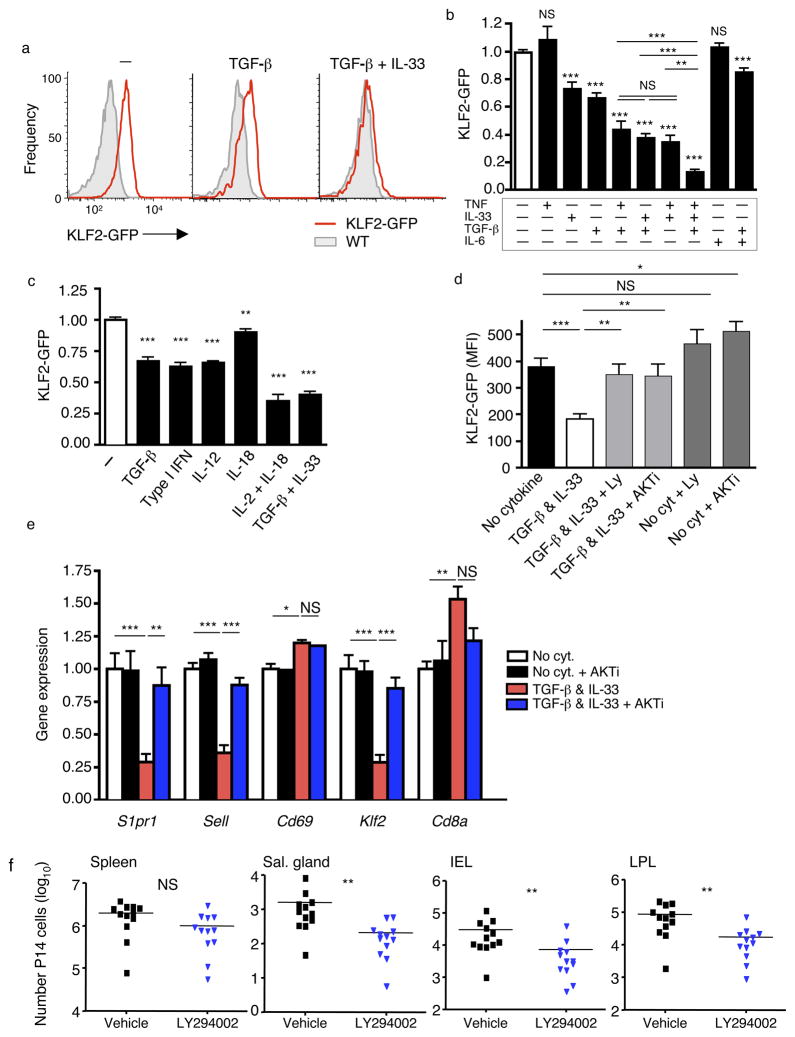
Cell-mediated immunity critically depends on the localization of lymphocytes at sites of infection. While some memory T cells recirculate, a distinct lineage (resident memory T cells (T(RM) cells)) are embedded in nonlymphoid tissues (NLTs) and mediate potent protective immunity. However, the defining transcriptional basis for the establishment of T(RM) cells is unknown. We found that CD8(+) T(RM) cells lacked expression of the transcription factor KLF2 and its target gene S1pr1 (which encodes S1P1, a receptor for sphingosine 1-phosphate). Forced expression of S1P1 prevented the establishment of T(RM) cells. Cytokines that induced a T(RM) cell phenotype (including transforming growth factor-β (TGF-β), interleukin 33 (IL-33) and tumor-necrosis factor) elicited downregulation of KLF2 expression in a pathway dependent on phosphatidylinositol-3-OH kinase (PI(3)K) and the kinase Akt, which suggested environmental regulation. Hence, regulation of KLF2 and S1P1 provides a switch that dictates whether CD8(+) T cells commit to recirculating or tissue-resident memory populations.


Figures

Figure 1
Figure 1. Differential KLF2 and S1PR1 expression by memory CD8+ T cells in lymphoid and non-lymphoid tissues
(a) KLF2GFP expression in splenic memory-phenotype CD8+ T cells (representative of n=9 from 3 independent experiments). (b) Expression of KLF2GFP in antigen-specific CD8+ T cells (endogenous Db/gp33 tetramer+ or adoptively transferred P14 CD8+ T cells) from indicated tissues, >28 days after LCMV infection. Data show fluorescence of KLF2GFP CD8+ T cells (black line) overlaid on CD8+ T cells from matched WT controls (grey filled). Data are representative of 6–12 animals from at least 3 independent experiments. (c, d) Analysis of KLF2GFP expression in adoptively transferred P14 CD8+ T cells, >28 days post LCMV infection. (c) IV anti-CD8 antibody was used to distinguish P14 T cells in tissue parenchyma (solid line) versus vascular-associated cells (dashed line). Data are overlaid with WT P14 CD8+ T cells (grey filled) as controls (representative of n=9 from 3 independent experiments). (d) CD69 versus KLF2GFP expression for parenchymal P14 T cells within indicated tissues (representative of n=9 from 3 independent experiments). (e) RNA was isolated from sorted P14 CD8+ T cells, isolated from spleen, salivary glands and LPL 30 days post LCMV infection, and subjected to RT-PCR for the indicated genes. Gene expression (relative to HPRT control) was normalized to the spleen for comparison between experiments. Compiled from four independent experiments (9–12 pooled mice each experiment), graphs show mean +/− SD. (f) Activated P14 CD8+ T cells were transduced with retroviral vectors encoding KLF2 (or a control, “Empty” vector). Two days later, cells expressing the transduction marker (Thy-1.1) were enriched and subjected to RT-PCR for the indicated genes. Gene expression, relative to HPRT controls, was normalized on empty vector controls. Data are compiled from 3 separate transduction experiments. At the same time point, cell surface expression of CD69 was determined on Thy-1.1+ve transduced cells (inset) - data shown are representative of at least 3 transduction experiments. Statistical analysis utilized one-way ANOVA (with Dunnett’s Multiple Comparison Test in (e)) and significance is indicated as follows: ***, p<0.001; **, p<0.01; *, p<0.05; NS, p>0.05.
Figure 2
Figure 2. KLF2 is downregulated during CD8+ T cell seeding of non-lymphoid tissues
Congenically distinct WT P14 and KLF2GFP P14 CD8+ T cells were adoptively co-transferred, and host mice infected with LCMV. (a, b) Histograms show fluorescence of KLF2GFP P14 CD8+ T cells (black line) and P14 CD8+ T cells (grey filled) for (a) cells analyzed before transfer (“naïve”) and from spleen/LN at 2 days following LCMV infection, and (b) cells from indicated tissues at listed time points following LCMV infection. Data are representative of n=9 animals from 3 independent experiments. (c) Percentage of CD103+ and KLF2GFP+ P14 CD8+ T cells at the indicated time points in lymphoid tissues and blood (left graphs, open symbols) and in NLTs (right graphs, closed symbols). Data are compiled from 3 independent experiments (n=9 animals) and graphs show mean +/− SD. Dotted line indicates threshold for detecting KLF2GFP+ cells, based on analysis of WT P14 T cells. (d) Absolute number of P14 CD8+ T cells isolated from indicated tissues at specified timepoints following LCMV infection. Data are compiled from a minimum of 15 animals (derived from a minimum of 4 experiments) with the exception of the brain (day 5; 12 animals from 4 experiments and day 30; 9 animals from 3 experiments). Data included cell numbers from empty-vector transduced P14 CD8+ T cells, discussed in Figure 4. Graphs show mean +/− SEM.
Figure 3
Figure 3. Distinct KLF2GFP expression by recirculating memory CD8+ T cells in NLT
(a–d) Parabiotic mice were generated (Supplementary Figure 3), in which animals bearing memory KLF2GFP P14 cells (induced by LCMV infection) were conjoined with infection-matched animals. At 13–17 days after surgery, paired animals were sacrificed and tissues harvested. The mice originally carrying the KLF2GFP P14 CD8+ T cell population were termed the “Donor” while the other animal in each parabiotic pair was termed the “Parabiont”. Data were compiled from 5 independent experiments (n=12 pairs), and gating was on live, non-vascular-associated P14 CD8+ T cells. (a) Relative abundance of P14 T cells in indicated tissues of donor and parabiont. This is shown as the percent of P14 T cells among total non-vascular-associated CD8+ cells in the parabiont, divided by the percent P14 T cells among total non-vascular-associated CD8+ cells in the donor. (b) KLF2GFP expression in spleen, salivary gland and LPL from parabiotic pairs. Black lines show GFP fluorescence of P14 KLF2GFP CD8+ T cells isolated from the donor (black line) or parabiont (red line). Donor spleen P14 KLF2GFP CD8+ T cells (dashed line) is included in all graphs for reference. Grey histograms show background fluorescence (host CD8+ T cells). (c and d) Geometric MFI (gMFI) for KLF2GFP (c) or CD69 (d) on P14 CD8+ T cells isolated from parabiont (red symbols) or donor (black symbols) animals. In (c), the background gMFI (of host CD8+ T cells) was subtracted. KLF2GFP and CD69 levels are not shown when <25 P14 T cells could be detected in a tissue.
Figure 4
Figure 4. Forced S1PR1 prevents establishment of TRM
Activated P14 CD8+T cells were transduced with retroviral vectors encoding S1PR1 and the transduction marker Thy-1.1 (“S1PR1”) or Thy-1.1 alone (Empty vector; “EV”) (see Supplementary Fig. 4a). Congenically distinct S1PR1 and empty-vector transduced cells were co-transferred into recipients subsequently infected with LCMV. (a) Histograms (representative of n=12 from 4 independent experiments) showing the frequency of cells expressing the transduction marker from the indicated retroviral vector, for P14 CD8+ T cells cells isolated from spleen and salivary gland >30 days post LCMV infection. (b) Transduction frequency of P14 CD8+ T cells, transduced with empty vector (black bars) or S1PR1 vector (white bars) in the parenchyma of the indicated tissues, 28–60 days post LCMV. Data are normalized to the percent transduction for the spleen from the same animal. Graphs show mean +/− SEM for 11–18 samples per group, compiled from at least 4 independent experiments. (c) Relative transduction for S1PR1 (white bars) or empty vector (black bars) transduced P14 CD8+ T cells present in vascular-associated versus tissue parenchyma of the salivary gland, isolated 5 days after LCMV infection. Bar graphs are compiled from 3 independent experiments (n=9). (d) Frequency of transduction (relative to spleen) of empty vector (black) versus S1PR1 (white) transduced P14 cells from kidney and salivary gland, at indicated time points following LCMV infection. N=9–18 from at least 3 independent experiments. Similar time-course trends were observed for other NLTs (data not shown). In all panels, analysis gated on live P14 CD8+ T cells, and (except panel c) with exclusion of vascular-associated cells. Statistical significance in this figure is indicated as follows: *, p<0.001; NS, p>0.05.
Figure 5
Figure 5. Accumulation of activated CD8+ T cells in inflamed skin is dependent on S1PR1 downregulation
(a) In vitro activated effector P14 and KLF2GFP P14 were co-transferred into recipients, which were subsequently treated with DNFB on the flank skin. After 5 days, the KLF2GFP gMFI was measured in indicated tissues (and corrected by subtracting the background for WT P14). Data are compiled from 3 independent experiments (n=10) and show mean +/− SEM. (b–c) Activated P14 CD8+ T cells transduced with S1PR1 (white symbols) and empty (black symbols) vectors were co-transferred into recipients that were subsequently treated with DNFB on the flank skin. At the indicated days post DNFB treatment, the number of transduced P14 CD8+ T cells in skin and spleen (b), and the percentage of transduced cells (normalized to the percent transduction in the spleen from the same animal) (c) was calculated. In (b), P14 T cell numbers are shown for both DNFB treated and untreated contralateral (“ctrl”) flank skin. Data are compiled from 3 independent experiments, with n=9. (d) Congenically distinct P14 CD8+ T cells were activated in vitro and transduced with retroviruses encoding KLF2 or an empty vector. Transduced cells were co-transferred into congenic recipients treated with DNFB as in (b, c). At the indicated time points, the frequency of each transduced donor population was determined in the treated skin. Data are compiled from 3 independent experiments (n=9). Statistical significance is indicated (**, p<0.001; *, p<0.05; NS, p>0.05).
Figure 6
Figure 6. The KLF2low phenotype of TRM does not correlate with sustained TCR engagement
(a) In vitro activated effector KLF2GFP P14 splenocytes were transferred into uninfected hosts, and 12–15 days later the KLF2GFP status of live non-vascular-associated P14 cells in spleen, blood and indicated NLTs were analyzed. N=8 from 3 independent experiments. The dotted line indicates threshold detection of KLF2GFP expressing cells (as in Fig. 2c). (b) To evaluate TCR activation status of CD8+ T cells in NLT, Nur77GFP P14 CD8+ T cells were transferred into C57BL/6 and either infected with LCMV or left uninfected (grey-filled). Thirty days after infection, Nur77GFP expression in P14 CD8+ T cells isolated from tissue parenchyma of indicated NLTs (black line) was compared to cells from the spleen (dotted line). Black filled histograms indicate Nur77GFP expression in P14 CD8+ T cells from animals injected with gp33–44 peptide 8 hours before harvest. Bar graph shows Nur77GFP expression as mean +/− SD, normalized to spleen for each group. Data are compiled from 4 independent experiments (n=11–12). Statistical analysis is relative to spleen. (**, p<0.001; *, p<0.05; NS, p>0.05).
Figure 7
Figure 7. Diverse cytokines induce KLF2 downregulation in activated CD8+ T cells, through a PI3K/Akt sensitive pathway
(a–c) WT and KLF2GFP P14 CD8+ T cells were co-adoptively transferred and recipients infected with LCMV for 4.5 days. Cells were then cultured with indicated cytokines for 40 hrs. Representative histograms (a) show GFP fluorescence of KLF2GFP P14 cells (red) and WT P14 cells (grey filled), while the bar graphs (b, c) indicate compiled data (from at least 4 experiments; n=11–18 in (b) and 3 experiments; n=9 in (c)), normalized on cells cultured with no added cytokines. Data show mean +/− SEM, with statistical analysis relative to the no cytokine group (except where indicated by horizontal bars). (d) P14 T cells were activated and cultured as in (a–c) with or without addition of LY294002 (10uM) or AKTi (1uM), to inhibit PI3K and AKT, respectively (n=11–12 from 4 independent experiments). (e) WT and KLF2GFP P14 CD8+ T cells were activated in vitro for 48 hours and then cultured with cytokines and/or inhibitors as in (d). Bar graph shows indicated gene expression determined by RT-PCR of sorted P14 CD8+ T cells. Data are compiled from 4 independent experiments for all genes except CD69 (3 experiments for each group with the exception of “no cytokine + Akti” which shows data from 2 experiments for comparison). (f) WT and KLF2GFP P14 CD8+ T cells were co-transferred, and recipients were then infected with LCMV for 4 days. Animals were treated twice (12 hours apart) with 50mg/kg LY294002 (blue symbols) or vehicle only (black symbols), and the animals sacrificed 12 hours later. Total live non-vascular-associated P14 cells were determined for tissues indicated. Data are compiled from 5 independent experiments (n=12 animals). Statistical significance for all panels is indicated as follows: ***, p<0.001; **, p<0.01; *, p<0.05; NS, p>0.05.

Comment in

Similar articles

Cited by

References

    1. Mackay CR, Marston WL, Dudler L. Naive and memory T cells show distinct pathways of lymphocyte recirculation. J Exp Med. 1990;171:801–817. - PMC - PubMed
    1. Klonowski KD, et al. Dynamics of blood-borne CD8 memory T cell migration in vivo. Immunity. 2004;20:551–562. - PubMed
    1. Masopust D, et al. Dynamic T cell migration program provides resident memory within intestinal epithelium. J Exp Med. 2010;207:553–564. - PMC - PubMed
    1. Wakim LM, Woodward-Davis A, Bevan MJ. Memory T cells persisting within the brain after local infection show functional adaptations to their tissue of residence. Proc Natl Acad Sci (USA) 2010;107:17872–17879. - PMC - PubMed
    1. Hofmann M, Pircher H. E-cadherin promotes accumulation of a unique memory CD8 T-cell population in murine salivary glands. Proc Natl Acad Sci (USA) 2011;108:16741–16746. - PMC - PubMed

Publication types

MeSH terms