

Accuracy of computational cerebral aneurysm hemodynamics using patient-specific endovascular measurements
- PMID: 24162859
- PMCID: PMC3941739
- DOI: 10.1007/s10439-013-0930-3
Accuracy of computational cerebral aneurysm hemodynamics using patient-specific endovascular measurements
Abstract
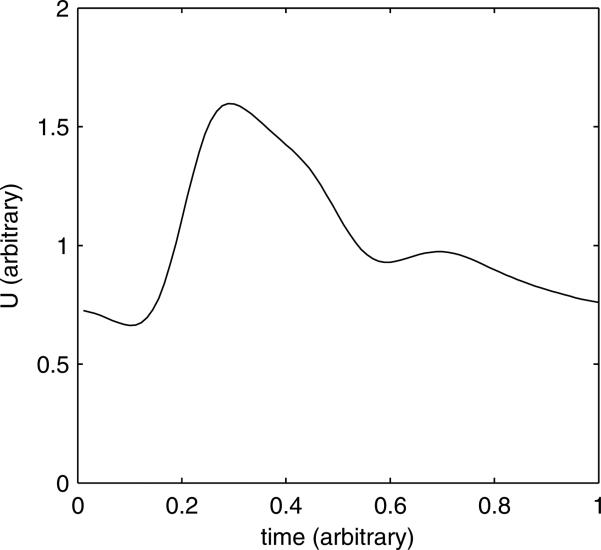
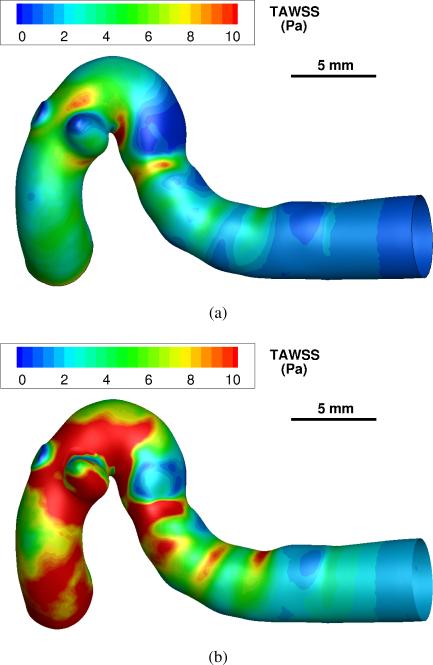
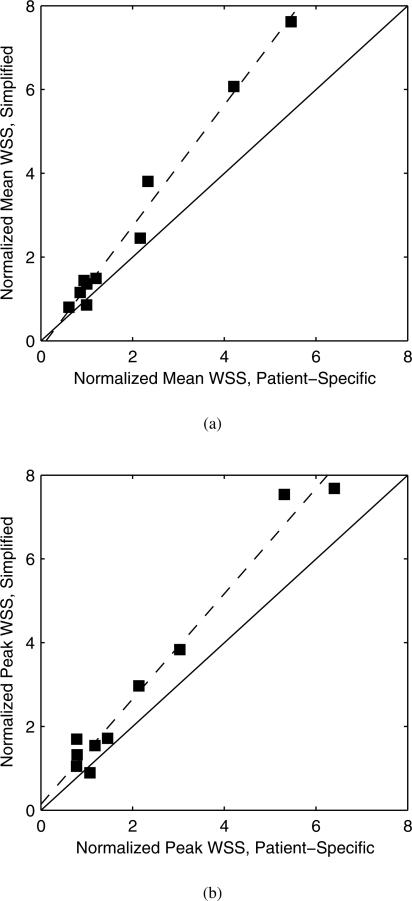
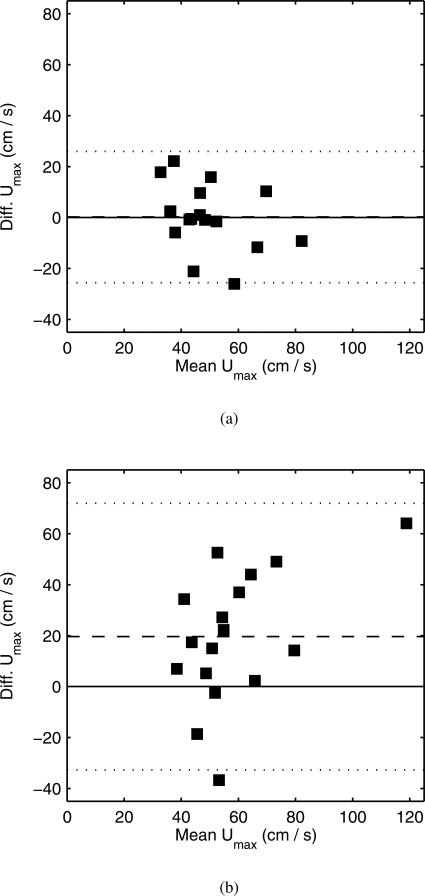
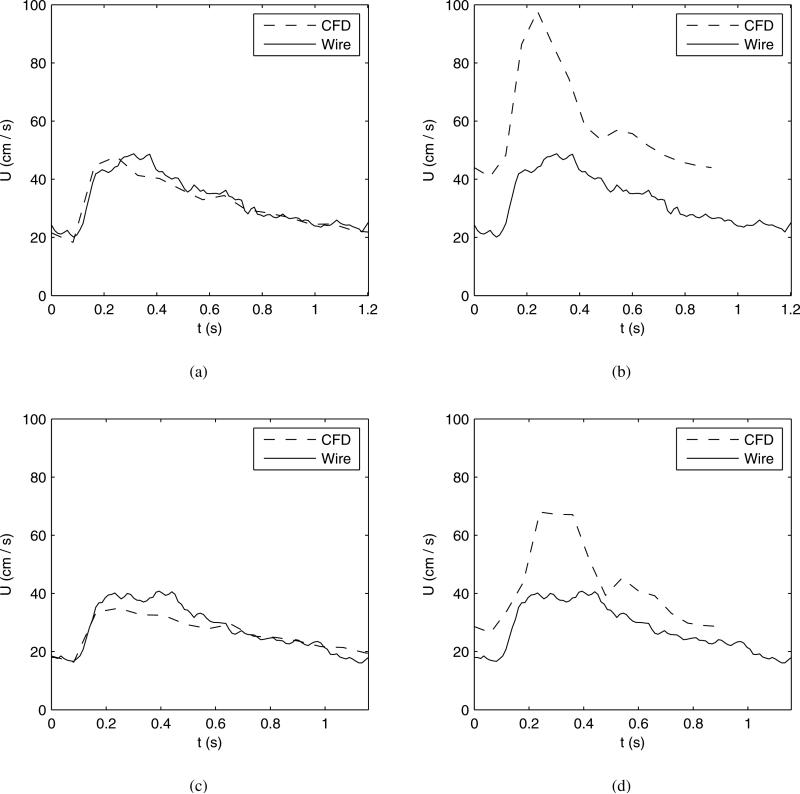
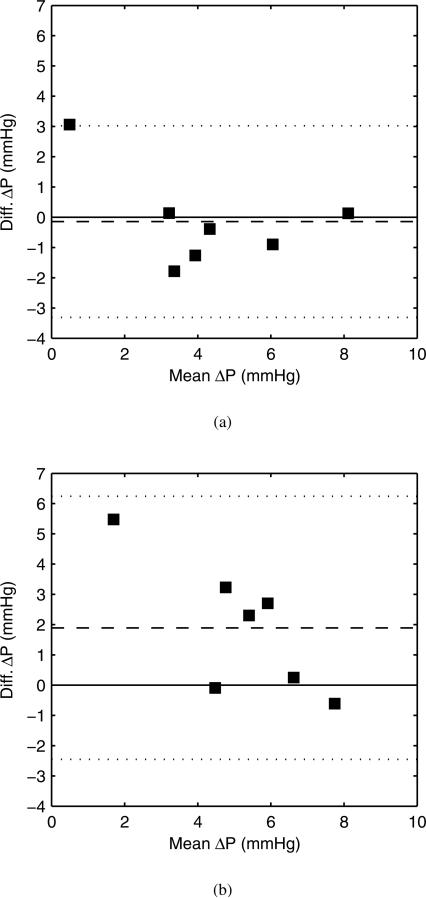
Computational hemodynamic simulations of cerebral aneurysms have traditionally relied on stereotypical boundary conditions (such as blood flow velocity and blood pressure) derived from published values as patient-specific measurements are unavailable or difficult to collect. However, controversy persists over the necessity of incorporating such patient-specific conditions into computational analyses. We perform simulations using both endovascularly-derived patient-specific and typical literature-derived inflow and outflow boundary conditions. Detailed three-dimensional anatomical models of the cerebral vasculature are developed from rotational angiography data, and blood flow velocity and pressure are measured in situ by a dual-sensor pressure and velocity endovascular guidewire at multiple peri-aneurysmal locations in 10 unruptured cerebral aneurysms. These measurements are used to define inflow and outflow boundary conditions for computational hemodynamic models of the aneurysms. The additional in situ measurements which are not prescribed in the simulation are then used to assess the accuracy of the simulated flow velocity and pressure drop. Simulated velocities using patient-specific boundary conditions show good agreement with the guidewire measurements at measurement locations inside the domain, with no bias in the agreement and a random scatter of ≈25%. Simulated velocities using the simplified, literature-derived values show a systematic bias and over-predicted velocity by ≈30% with a random scatter of ≈40%. Computational hemodynamics using endovascularly measured patient-specific boundary conditions have the potential to improve treatment predictions as they provide more accurate and precise results of the aneurysmal hemodynamics than those based on commonly accepted reference values for boundary conditions.
Figures
Similar articles
-
Cerebral aneurysms treated with flow-diverting stents: computational models with intravascular blood flow measurements.AJNR Am J Neuroradiol. 2014 Jan;35(1):143-8. doi: 10.3174/ajnr.A3624. Epub 2013 Jul 18. AJNR Am J Neuroradiol. 2014. PMID: 23868162 Free PMC article.
-
Inter-patient variations in flow boundary conditions at middle cerebral artery from 7T PC-MRI and influence on Computational Fluid Dynamics of intracranial aneurysms.Comput Biol Med. 2020 May;120:103759. doi: 10.1016/j.compbiomed.2020.103759. Epub 2020 Apr 15. Comput Biol Med. 2020. PMID: 32421656
-
Intra-aneurysmal flow patterns and wall shear stresses calculated with computational flow dynamics in an anterior communicating artery aneurysm depend on knowledge of patient-specific inflow rates.Acta Neurochir (Wien). 2009 May;151(5):479-85; discussion 485. doi: 10.1007/s00701-009-0247-z. Epub 2009 Apr 3. Acta Neurochir (Wien). 2009. PMID: 19343271
-
Hemodynamics of cerebral aneurysms: computational analyses of aneurysm progress and treatment.Comput Math Methods Med. 2012;2012:782801. doi: 10.1155/2012/782801. Epub 2012 Feb 19. Comput Math Methods Med. 2012. PMID: 22454695 Free PMC article. Review.
-
Hemodynamics of Cerebral Aneurysms: Connecting Medical Imaging and Biomechanical Analysis.Annu Rev Biomed Eng. 2020 Jun 4;22:231-256. doi: 10.1146/annurev-bioeng-092419-061429. Epub 2020 Mar 25. Annu Rev Biomed Eng. 2020. PMID: 32212833 Free PMC article. Review.
Cited by
-
A Highly Automated Computational Method for Modeling of Intracranial Aneurysm Hemodynamics.Front Physiol. 2018 Jun 12;9:681. doi: 10.3389/fphys.2018.00681. eCollection 2018. Front Physiol. 2018. PMID: 29946264 Free PMC article.
-
Cerebral aneurysm hemodynamics indicative of instability are associated with heterogeneous wall motion measured by amplified MRI.J Neurointerv Surg. 2025 Jul 15:jnis-2025-023486. doi: 10.1136/jnis-2025-023486. Online ahead of print. J Neurointerv Surg. 2025. PMID: 40664429
-
Efficient simulation of a low-profile visualized intraluminal support device: a novel fast virtual stenting technique.Chin Neurosurg J. 2018 Mar 22;4:6. doi: 10.1186/s41016-018-0112-0. eCollection 2018. Chin Neurosurg J. 2018. PMID: 32922867 Free PMC article.
-
Improving the accuracy of computational fluid dynamics simulations of coiled cerebral aneurysms using finite element modeling.J Biomech. 2023 Aug;157:111733. doi: 10.1016/j.jbiomech.2023.111733. Epub 2023 Jul 19. J Biomech. 2023. PMID: 37527606 Free PMC article.
-
Review of Biomedical Applications of Contactless Imaging of Neonates Using Infrared Thermography and Beyond.Methods Protoc. 2018 Oct 29;1(4):39. doi: 10.3390/mps1040039. Methods Protoc. 2018. PMID: 31164579 Free PMC article. Review.
References
-
- Ackerstaff RG, Suttorp MJ, van den Berg JC, Overtoom TT, Vos JA, Bal ET, Zanen P. Prediction of early cerebral outcome by transcranial doppler monitoring in carotid bifurcation angioplasty and stenting. J Vasc Surg. 2005;41(4):618–624. - PubMed
-
- Augst AD, Barratt DC, Hughes AD, Glor FP, Thom SA, Xu XY. Accuracy and reproducibility of CFD predicted wall shear stress using 3D ultrasound images. J Biomech Eng. 2003;125:218–222. - PubMed
-
- Cebral JR, Castro MA, Appanaboyina S, Putman CM, Millan D, Frangi AF. Efficient pipeline for image-based patient-specific analysis of cerebral aneurysm hemodynamics: technique and sensitivity. IEEE Trans Med Imaging. 2005;24(4):457–467. - PubMed
Publication types
MeSH terms
Grants and funding
LinkOut - more resources
Full Text Sources
Other Literature Sources
Medical
