. 2013 Dec;10(12):1219-24.
doi: 10.1038/nmeth.2701. Epub 2013 Oct 27.

A superfolding Spinach2 reveals the dynamic nature of trinucleotide repeat-containing RNA

Affiliations

A superfolding Spinach2 reveals the dynamic nature of trinucleotide repeat-containing RNA

Rita L Strack et al. Nat Methods. 2013 Dec.

Abstract

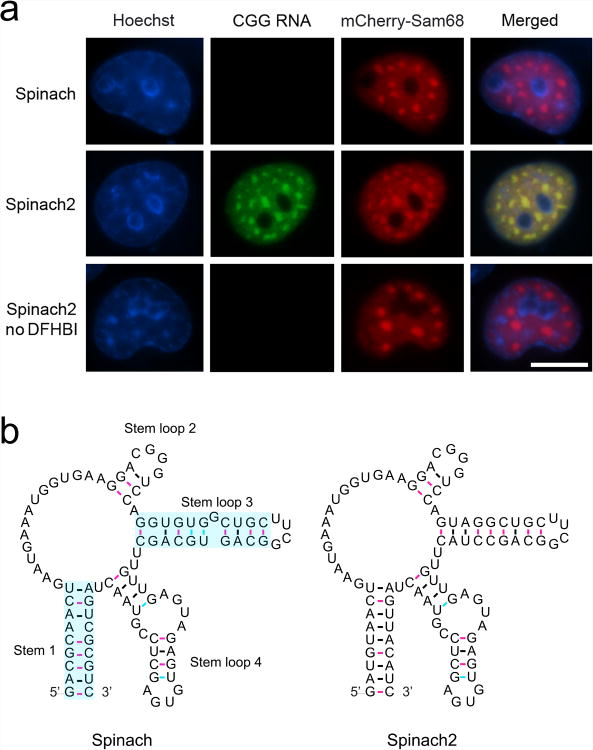
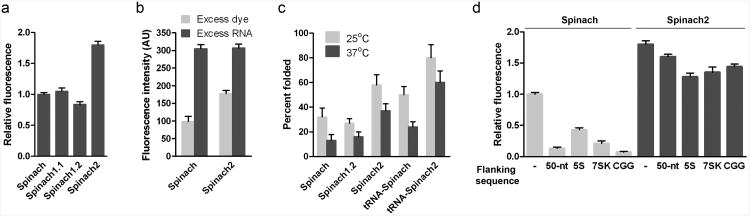
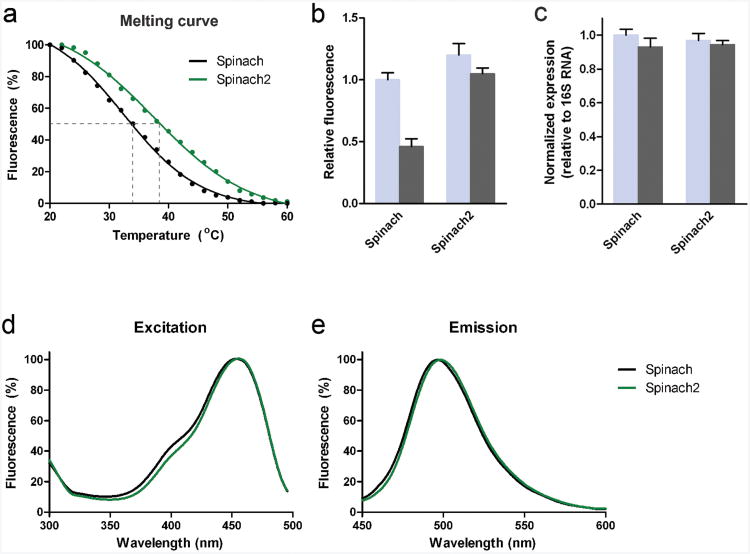
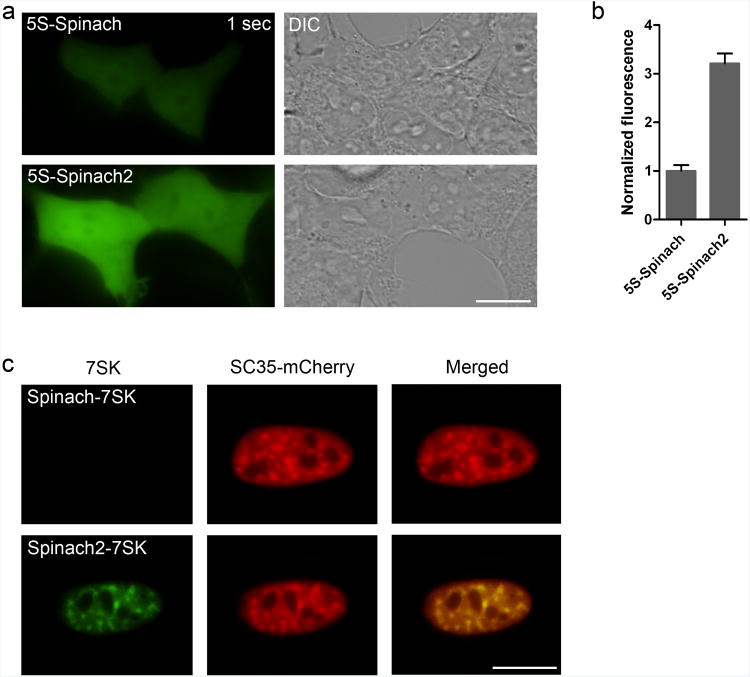
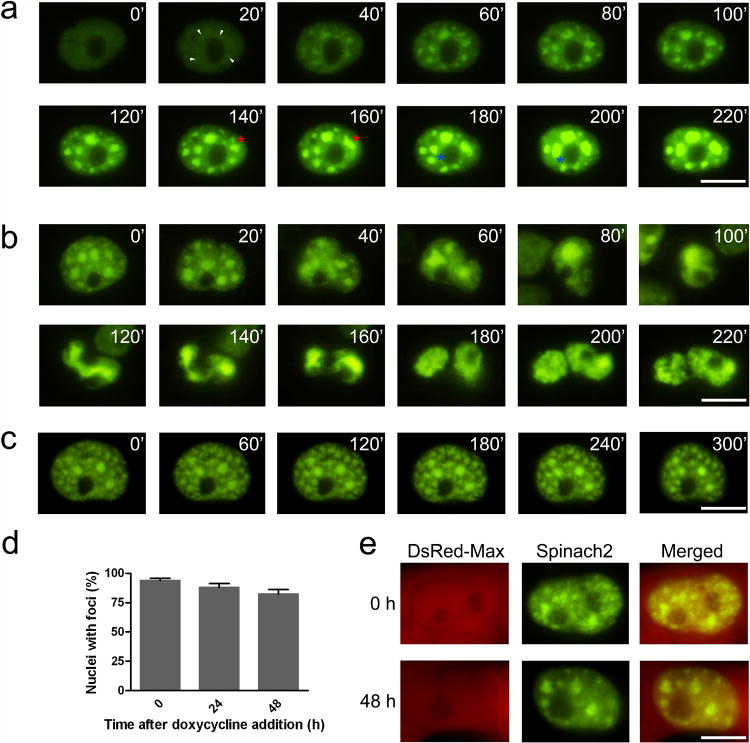
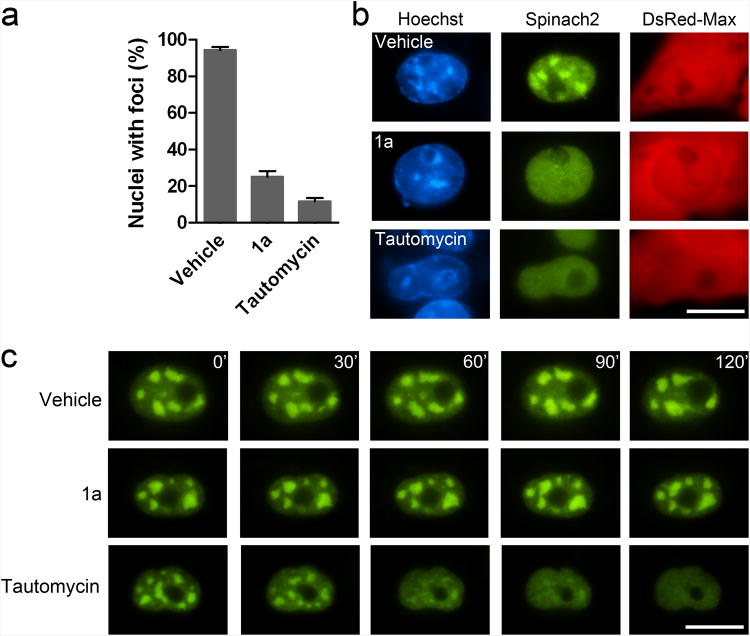
Imaging RNA in living cells is a challenging problem in cell biology. One strategy for genetically encoding fluorescent RNAs is to express them as fusions with Spinach, an 'RNA mimic of GFP'. We found that Spinach was dimmer than expected when used to tag constructs in living cells owing to a combination of thermal instability and a propensity for misfolding. Using systematic mutagenesis, we generated Spinach2 that overcomes these issues and can be used to image diverse RNAs. Using Spinach2, we detailed the dynamics of the CGG trinucleotide repeat-containing 'toxic RNA' associated with Fragile X-associated tremor/ataxia syndrome, and show that these RNAs form nuclear foci with unexpected morphological plasticity that is regulated by the cell cycle and by small molecules. Together, these data demonstrate that Spinach2 exhibits improved versatility for fluorescently labeling RNAs in living cells.


Figures

Figure 1
Figure 1. CGG-Spinach2 containing RNAs can be imaged in living cells
(a) COS-7 expressing (CGG)60-Spinach (top row) or (CGG)60-Spinach2 (middle row) and mCherry-hSam68 in the presence of DFHBI. Cells expressing (CGG)60-Spinach2 and mCherry-hSam68 in the absence of DFHBI are also shown (bottom row). Nuclei were stained using Hoechst. Scale bar, 10 μm. (b) Secondary structure of Spinach and Spinach2. Spinach is predicted to form one stem and three stem-loops. Stems 1 and stem-loop 3 (shaded cyan) were mutated to generate Spinach2.
Figure 2
Figure 2. Spinach2 is brighter than Spinach due to improved folding
(a) Normalized brightness values of Spinach and derivatives. The fluorescence signal from 1 μM RNA and 10 μM DFHBI was measured at 25°C and normalized to Spinach fluorescence. Data represent mean and s.e.m. values for three independent replicates. (b) Results of folding assay. Data represent mean and s.e.m. values for three independent replicates. (c) Percent folded values of Spinach and derivatives at 25°C and 37°C. Data represent mean and s.e.m. values for three independent replicates. (d) Normalized brightness values of Spinach and derivatives. The fluorescence signal from 1 μM RNA and 10 μM DFHBI was measured at 25°C and normalized to Spinach fluorescence. Data represent mean and s.e.m. values for three independent replicates.
Figure 3
Figure 3. Properties of Spinach and Spinach2 in vitro and in bacteria
(a) Spinach2 has increased thermostability relative to Spinach. The fluorescence of Spinach (black) and Spinach2 (green) was measured in the presence of DFHBI from 20 to 60 °C. Shown are representative data (dots) along with the best fit curve from fitting with the Boltzmann sigmoidal equation (line). (b) Excitation spectra of Spinach and Spinach2. Fluorescence excitation was measured from 300-500 nm with emission recorded at 510 ± 10 nm. (c) Emission spectra of Spinach and Spinach2. Fluorescence was excited with 420 ± 10 nmlight and emission was recorded from 450-600 nm. In all cases, spectra are normalized to maximal signal. (d) Normalized fluorescence signal from E. coli expressing either Spinach or Spinach2. All values shown are normalized to Spinach signal at 25 °C. Values plotted are mean and s.e.m. values of three independent experiments. (e) Normalized Spinach and Spinach2 expression in E. coli. Total RNA from samples used in fluorescence measurements were then subjected to reverse transcription followed by qRT-PCR. Spinach and Spinach2 signal were normalized to 16S RNA. Data represent mean and s.e.m. values for three independent replicates.
Figure 4
Figure 4. 5S-Spinach2 is brighter than 5S-Spinach in mammalian cells
(a) HEK293T cells were transiently transfected to express either 5S-Spinach or 5S-Spinach2 under the control of the 5S promoter. Cells were incubated with 20 μM DFHBI and imaged with a 1 sec (left column) exposure time. Green fluorescence and DIC (right column) images are shown. Scale bar, 10 μm. (b) The brightness for cells labeled with either 5S-Spinach or 5S-Spinach2 were determined and normalized for area. 5S-Spinach signal was normalized to one. 5S-Spinach2 was 3.2-fold brighter than Spinach. Data shown represent mean and s.e.m. values for 20 cells per condition. (c) HeLa cells were transiently transfected to express either Spinach-7SK or Spinach2-7SKunder the control of the CMV promoter. Cells were cotransfected with SC35-mCherry, which labels nuclear speckles. Cells were incubated with 20 μM DFHBI and imaged for 200 ms. Green and red fluorescence images are shown along with overlaid images. Scale bar, 10 μm.
Figure 5
Figure 5. Imaging RNA foci in COS-7 cells
(a) Foci formation in COS-7 cells after transient transfection with a CGG-Spinach2 vector. At 2 h post-transfection, cells were incubated with imaging medium containing DFHBI and imaged every 20 min for 6 h. In these images, time zero indicates the first frame that displayed fluorescence above background. Small foci formed de novo (white arrowheads) are highlighted. Merging foci are also highlighted foci (red and blue asterisks). Scale bar, 10 μm. (b) RNA foci are partitioned and divided during cell division. Scale bar, 10 μm. (c) (CGG)60-Spinach2 signal persists in foci after transcriptional silencing. Cells containing CGG aggregates were treated with 1 μg/mL actinomycin D to inhibit transcription and monitored for changes in foci. Images obtained every hour for 5 h are shown. Scale bar, 10 μm. (d) (CGG)60-Spinach2 signal persists in foci for over 48 h after transcriptional silencing. A TET-Off expression system was used in COS-7 cells to test foci stability in the absence of new transcription over longer time periods. Data shown represent the mean and s.e.m. values for three independent replicates in which 100 DsRed-positive cells were counted for each treatment. (e) Representative nuclei for 0 and 48 h after doxycycline addition. Scale bar, 10 μm.
Figure 6
Figure 6. The effects of tautomycin and 1a on CGG RNA foci
(a) Tautomycin and 1a prevent the formation of CGG repeat foci. Transfected cells were treated with vehicle, 20 μM 1a, or 5 μM tautomycin was added to cells. After 24 h, 100 DsRed-positive cells were analyzed for the presence of nuclear foci for each condition. 94 ± 1.4, 25 ± 4.9, and 12 ± 4.2% of nuclei contained foci with vehicle, 1a, and tautomycin, respectively. Data shown are mean and s.e.m. values for three independent experiments. (b) Representative images of nuclei after 24 h of treatment. DsRed-Max was used as a transfection control. (c) Preexisting (CGG)60-Spinach2 foci are disaggregated by tautomycin. COS-7 cells expressing (CGG)60-Spinach2 foci were incubated with vehicle, 20 μM 1a, or 5 μM tautomycin and imaged for 2 h after drug treatment. Scale bar 10 μm.

References

    1. Medioni C, Mowry K, Besse F. Principles and roles of mRNA localization in animal development. Development. 2012;139:3263–3276. - PMC - PubMed
    1. Jansen RP, Niessing D. Assembly of mRNA-protein complexes for directional mRNA transport in eukaryotes--an overview. Curr Protein Pept Sci. 2012;13:284–293. - PMC - PubMed
    1. Paige JS, Wu KY, Jaffrey SR. RNA mimics of green fluorescent protein. Science. 2011;333:642–646. - PMC - PubMed
    1. Sellier C, et al. Sam68 sequestration and partial loss of function are associated with splicing alterations in FXTAS patients. EMBO J. 2010;29:1248–1261. - PMC - PubMed
    1. Paige JS, Nguyen-Duc T, Song W, Jaffrey SR. Fluorescence imaging of cellular metabolites with RNA. Science. 2012;335:1194. - PMC - PubMed

Publication types