. 2014 Jan;42(2):999-1015.
doi: 10.1093/nar/gkt921. Epub 2013 Oct 24.

REST mediates androgen receptor actions on gene repression and predicts early recurrence of prostate cancer

Affiliations

REST mediates androgen receptor actions on gene repression and predicts early recurrence of prostate cancer

Charlotte Svensson et al. Nucleic Acids Res. 2014 Jan.

Abstract

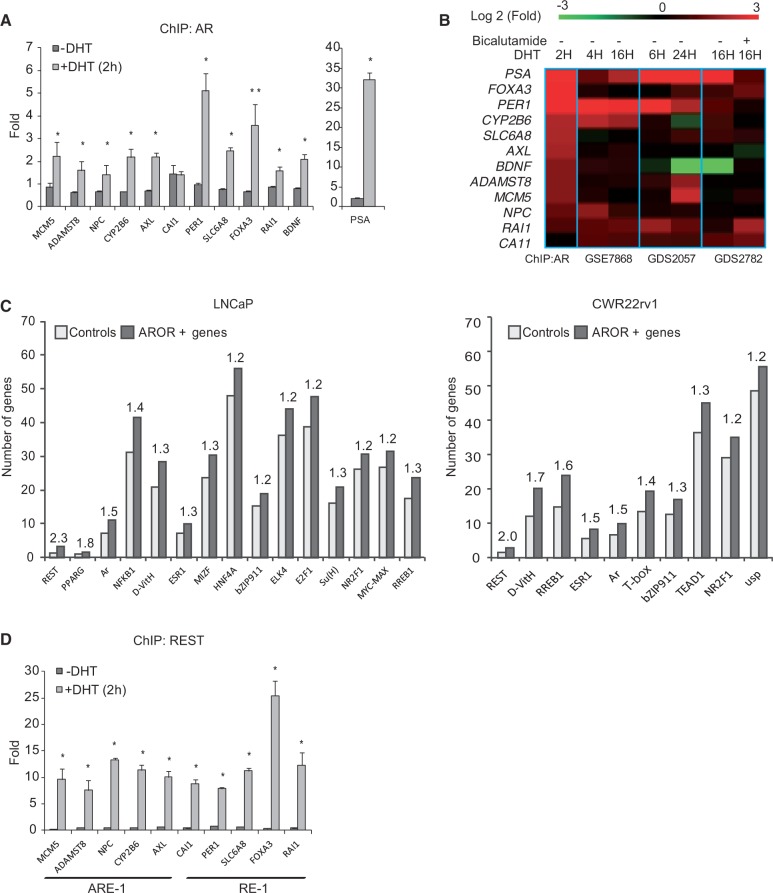
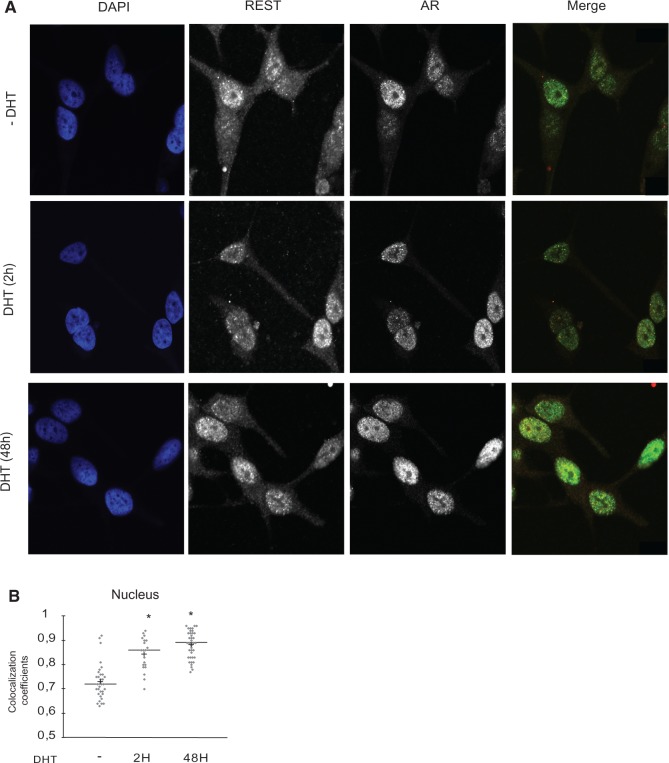
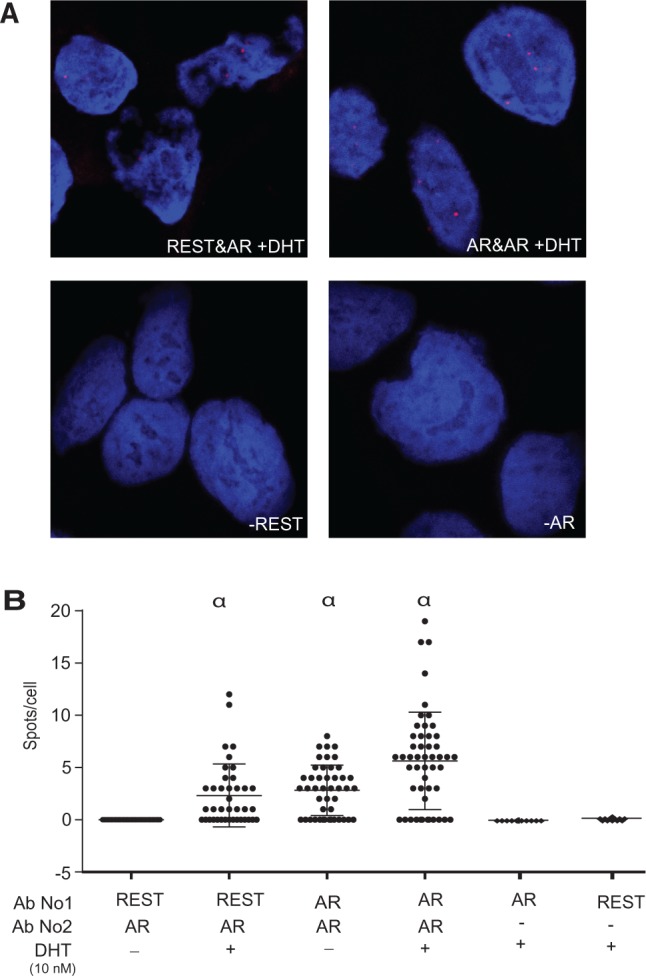
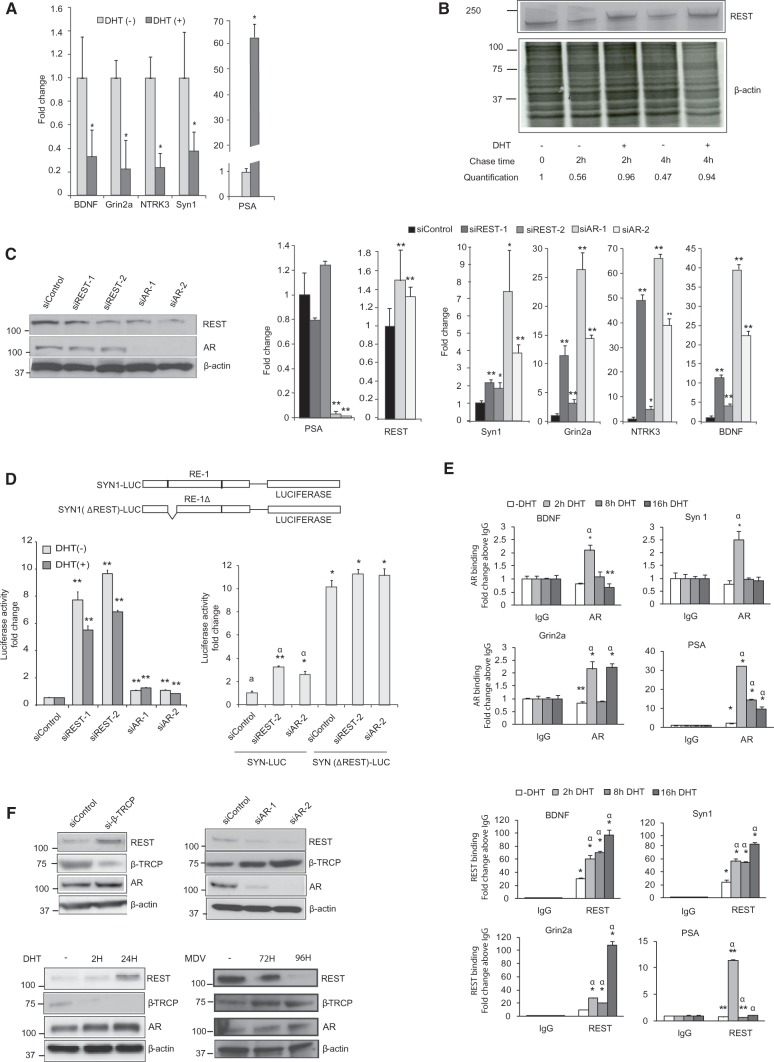
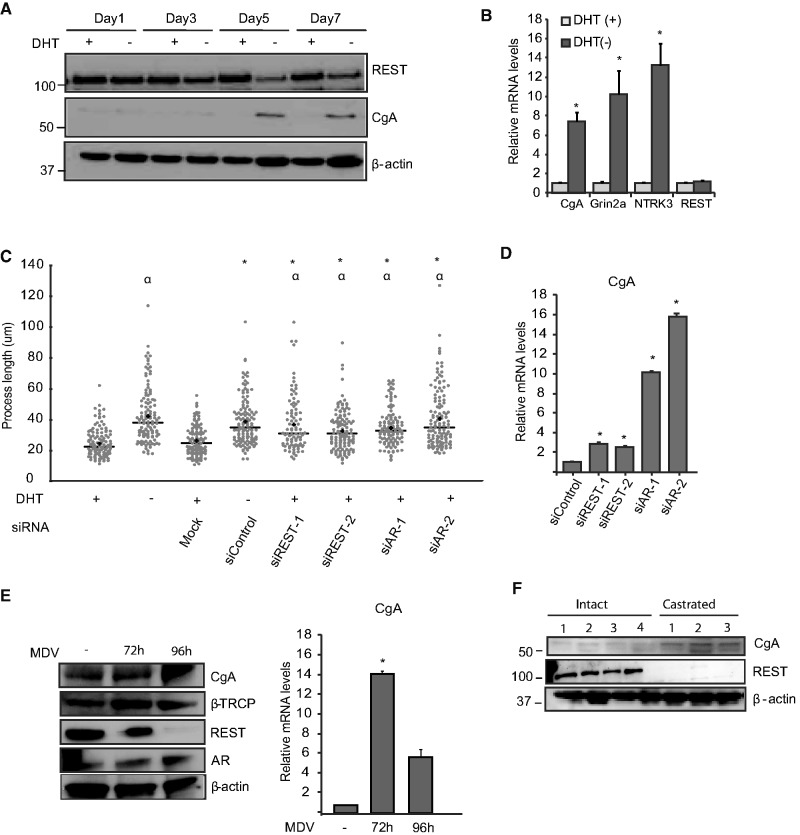
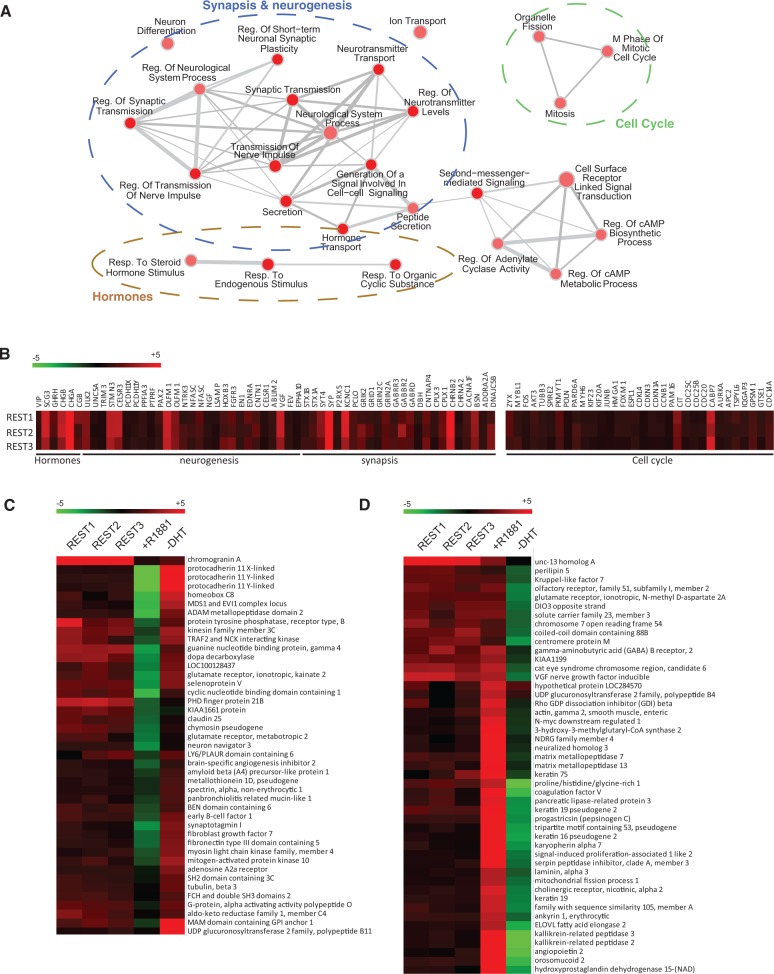
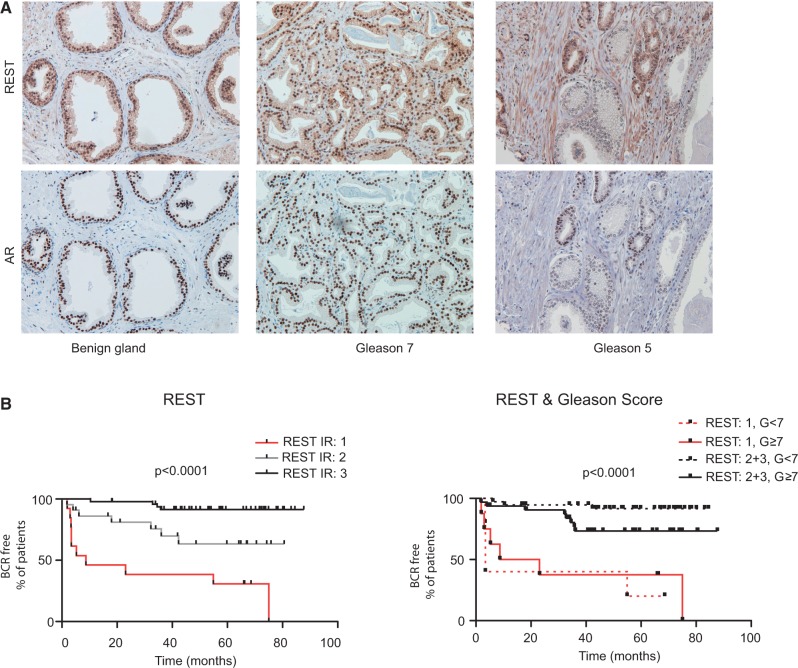
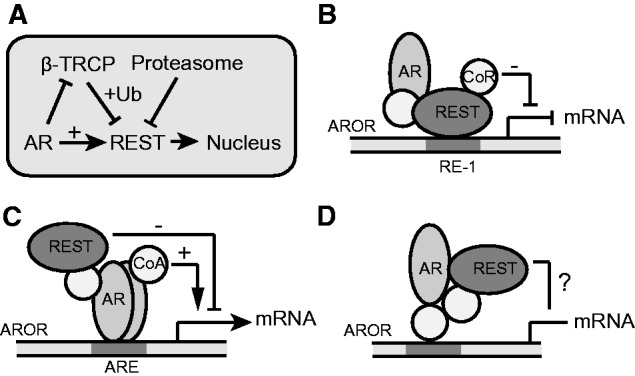
The androgen receptor (AR) is a key regulator of prostate tumorgenesis through actions that are not fully understood. We identified the repressor element (RE)-1 silencing transcription factor (REST) as a mediator of AR actions on gene repression. Chromatin immunoprecipitation showed that AR binds chromatin regions containing well-characterized cis-elements known to mediate REST transcriptional repression, while cell imaging studies confirmed that REST and AR closely co-localize in vivo. Androgen-induced gene repression also involves modulation of REST protein turnover through actions on the ubiquitin ligase β-TRCP. Androgen deprivation or AR blockage with inhibitor MDV3100 (Enzalutamide) leads to neuroendocrine (NE) differentiation, a phenomenon that is mimicked by REST inactivation. Gene expression profiling revealed that REST not only acts to repress neuronal genes but also genes involved in cell cycle progression, including Aurora Kinase A, that has previously been implicated in the growth of NE-like castration-resistant tumors. The analysis of prostate cancer tissue microarrays revealed that tumors with reduced expression of REST have higher probability of early recurrence, independently of their Gleason score. The demonstration that REST modulates AR actions in prostate epithelia and that REST expression is negatively correlated with disease recurrence after prostatectomy, invite a deeper characterization of its role in prostate carcinogenesis.


Figures

Figure 1.
Figure 1.
Analysis of ARORs by ChIP. (A) Quantitative PCR analysis of AR binding to promoter region of ARE– and RE-1–containing genes in LNCaP cells treated or not with DHT for 2 h. All gene names are provided by genenames.org. Students t-test was used to analyze the statistical significance of the differences observed on DHT treated versus control samples (*P < 0.05 and **P < 0.01). (B) Heat map illustrating changes in expression on androgen or bicalutamide treatment for genes whose promoters bind AR in ChIP analysis. Data were obtained from GEO database (http://www.ncbi.nlm.nih.gov/geo/). The experiments accession numbers are indicated (C) ChIP microarray analysis. The number of regions containing binding sites for the indicated transcription factors within AROR (dark gray) or a set of control regions that did not bind the AR in the ChIP microarray analysis, denoted as controls (light gray). Only the TFBS, with a statistically significant (P < 0.05, χ2 analysis) overrepresentation within AROR, are shown. The transcription factor binding sites are named using JASPAR similarity matrix names as follows: REST, repressor element-1 silencing transcription factor; PPARG, peroxisome proliferation activated receptor gamma; AR, androgen receptor; NFκB, nuclear factor of kappa light polypeptide gene enhancer in B cells; D-Vit, vitamin D receptor; ESR1, estrogen receptor 1; MIZF, histone H4 transcription factor; bZIP911, ELK4, ETS domain proteins; E2F1, E2F transcription factor; Su(H), suppressor of hairless; NR2F1, nuclear receptor subfamily 2, group F, member 1; MAX MYC, Myc associated factor X; RREB1, Ras-responsive element binding protein 1; T, T box protein; TEAD1, transcriptional enhancer factor TEF1; and NR2F1, nuclear receptor subfamily 2, group F, family 1. (D) ChIP analysis of REST binding to promoter region of ARE and RE-1 containing genes in LNCaP cells treated or not with DHT for 2 h. The statistical significance was analyzed using Students t-test (*P < 0.01).
Figure 2.
Figure 2.
Co-localization of REST and AR in PCa cells. (A) The protein expression levels of REST and AR were measured by co-staining with specific antibodies and visualized by immunofluorescence using a confocal microscope. Parallel images acquired for REST (594 nm) and AR (488 nm) were analyzed. Representative images of REST and AR expression in cells grown in DHT are shown. Nuclear staining was performed with DAPI. The images show the nuclear and cytosolic co-localization of REST and AR. (B) The correlation coefficient was calculated from the pixel signal intensity measurements acquired in both wavelengths and within the cell nucleus. This parameter is denoted as the AR/REST co-localization coefficient. Asterisk indicates statistically significant differences between DHT-treated and control cells (P < 0.001, Student’s t-test).
Figure 3.
Figure 3.
In situ proximity ligation assays. (A) Representative images of REST/AR co-localization in situ visualized by the proximity ligation assays. LNCaP cells were stained with REST and/or AR antibodies as indicated and subjected to proximity ligation assays to measure their co-localization in situ, visualized by the appearance of high-intensity fluorescent spots at the 634 nm wavelength. Two different antibodies recognizing the AR and raised from different species were used as positive controls. Analyses performed in the absence of one of the primary antibodies were used as negative controls. (B) The co-localization of AR and REST was analyzed by the quantification of the number of fluorescent spots localized in the nucleus of individual cells (α, P < 0.0001).
Figure 4.
Figure 4.
Androgens regulate REST function. (A) LNCaP cells were starved from steroids and then treated with DHT for 24 h. RT-PCR was used to measure expression levels of four known REST target genes: BDNF, Grin2a, NTRK3 and Synapsin1. All differences were statistically significant (*P < 0.01). (B) In a pulse chase experiment, LNCaP cells were labeled with 35S-methionine and treated for 2 and 4 h with androgen when REST was immunoprecipitated and analyzed by autoradiography. (C) LNCaP cells were transfected with two siRNA targeting either REST or the AR, followed by measurements of the mRNA levels of the indicated genes. Asterisks indicate statistically significant differences between the cells transfected with control siRNA and those targeting AR or REST (*P < 0.05, **P < 0.01). Western blot shows protein levels of REST and AR after REST and AR knockdown. (D) A luciferase reporter construct driven by the synapsin 1 gene promoter region containing the REST response element (RE-1) and a variant in which the N-terminal half region of the RE element was deleted was used to assess REST-mediated repression in the cells transfected with siRNAs targeting the REST and AR in the presence and absence of androgens. Significant differences in the comparison between luciferase activity in the cells transfected with siControl and Syn-Luc and the other experimental groups are denoted by *P < 0.05 or **P < 0.01. Significant differences between the control group–transfected Syn-luciferase mutant and the rest of the groups are marked with α, P < 0.01. (E) Measurement of REST and AR binding to chromatin regions within the promoters of BDNF, Syn1 and Grin2a genes containing an RE-1 or to the ARE in a PSA gene enhancer. The influence of DHT treatment on REST and AR chromatin binding was also measured. DNA quantization was performed by q-PCR. Means differences between IgG control ChIP and those performed with the indicated antibodies (AR or REST) were compared by Student’s t-test (*P < 0.01 and **P < 0.05). The statistical differences between DHT treated and untreated samples was also analyzed (α denotes a P < 0.05) (F) Measurement of REST, AR and β-TRCP levels in LNCaP cells with the indicated treatments.
Figure 5.
Figure 5.
REST regulates NE differentiation in LNCaP cells. (A) Protein levels of NE marker chromogranin A and REST in cells depleted of androgens for the indicated times in the presence and absence of DHT. (B) mRNA levels of the REST target genes: Grin2a and NTRK3 and NE marker chromogranin A in same experiment as above. (C) NE differentiation was quantified by analyzing the length of cytoplasmic extensions processes during androgen deprivation for 7 days or in cells grown in the presence of androgen (+DHT) but transfected with siRNAs targeting REST or the AR. Statistical analysis was performed using the Wilcox ranked test; asterisk denotes statistically significant differences (P < 0.001) with the siControl +DHT group, while α denotes significant differences (P < 0.001) in comparison with control nontransfected cells −DHT. (D) mRNA levels of CgA in REST and AR knockdowns (*P < 0.05, Student’s t-test). (E) Protein and mRNA levels of chromogranin A after 72- and 96-h treatment with AR antagonist MDV3100. (F) Chromogranin A and REST levels in LNCaP orhotopic xenograft grown in castrated or intact mice.
Figure 6.
Figure 6.
Effects of REST knockdown on gene expression. (A) Gene expression profiling was used to identify protein coding genes that increase expression on REST downregulation. The regulated genes where assigned to biological functions according to Gene Ontology categories. The enrichment of specific categories in comparison with what is expected from similar analysis for the entire genome and the associated P were calculated. Results (P < 0.05) were visualized using Cytoscape. Nodes identify functional categories, with the size representing number of genes and color representing P-value. The thicknesses of the edges indicate the number of overlapping genes between categories. (B) Selected genes identified within specified categories. REST 1, 2 and 3 represent experiments performed with three independent REST targeting siRNAs. Log2-transformed fold ratios are indicated by the color code. (C) Expression changes of selected genes consistently upregulated by REST knockdown that are also repressed by treatment with synthetic androgen R1881 (10 nM). −DHT indicates changes induced by androgen depletion. (D) As above by showing selected genes consistently upregulated by REST knockdown that are also induced by treatment with synthetic androgen R1881 (10 nM).
Figure 7.
Figure 7.
Immunohistochemical analysis of REST and AR expression in consecutive sections of PCa TMAs. (A) Examples of tissue cores of benign glands and tumors (Gleason grade 7 and 5) illustrate the correlation in expression of REST and AR. (B) Kaplan–Meier curves for the time to PSA recurrence after radical prostatectomies for patients expressing low (1, n = 13), medium (2, n = 22) or high (3, n = 49) REST protein levels (left panel) or according to the Gleason grade at the time of the prostatectomy: G < 7, n = 51; G = 7, n = 35; G > 7, n = 8 (right panel). The P-value was calculated according to the Mantel–Cox test. Table 1 presents a summary of REST immune reactivity in relation to clinical parameters.
Figure 8.
Figure 8.
A working model for AR and REST functional interaction in PCa cells. (A) Androgens can reduce REST turnover by inhibiting the expression of β-TRCP, a known ubiquitin ligase of REST. In the presence of androgens, REST accumulates and translocates to the nucleus where it can bind chromatin in regions occupied by the AR (AROR). Depending on the sequence context, this binding leads to different transcriptional outcomes: (B) Sustained binding of REST to RE-1 sites in gene promoters leads to transcriptional inhibition. (C) Binding of REST to regions containing ARE can in some instances limit the stimulatory effects of androgens on transcription. (D) A number of regions can bind both AR and REST with no obvious effects on transcription of nearby genes. The outcome of these binding events may be determined by yet unidentified auxiliary proteins and chromatin modifiers.

References

    1. Epstein JI, Amin M, Boccon-Gibod L, Egevad L, Humphrey PA, Mikuz G, Newling D, Nilsson S, Sakr W, Srigley JR, et al. Prognostic factors and reporting of prostate carcinoma in radical prostatectomy and pelvic lymphadenectomy specimens. Scand. J. Urol. Nephrol. 2005:34–63. - PubMed
    1. Taichman RS, Loberg RD, Mehra R, Pienta KJ. The evolving biology and treatment of prostate cancer. J. Clin. Invest. 2007;117:2351–2361. - PMC - PubMed
    1. Pienta KJ, Bradley D. Mechanisms underlying the development of androgen-independent prostate cancer. Clin. Cancer Res. 2006;12:1665–1671. - PubMed
    1. Schaeffer EM, Marchionni L, Huang Z, Simons B, Blackman A, Yu W, Parmigiani G, Berman DM. Androgen-induced programs for prostate epithelial growth and invasion arise in embryogenesis and are reactivated in cancer. Oncogene. 2008;27:7180–7191. - PMC - PubMed
    1. Heinlein CA, Chang C. Androgen receptor in prostate cancer. Endocr. Rev. 2004;25:276–308. - PubMed

Publication types

MeSH terms

Associated data