. 2014 Mar 1;23(5):1260-70.
doi: 10.1093/hmg/ddt516. Epub 2013 Oct 24.

Sex-biased methylome and transcriptome in human prefrontal cortex

Affiliations

Sex-biased methylome and transcriptome in human prefrontal cortex

Hongqin Xu et al. Hum Mol Genet. .

Abstract

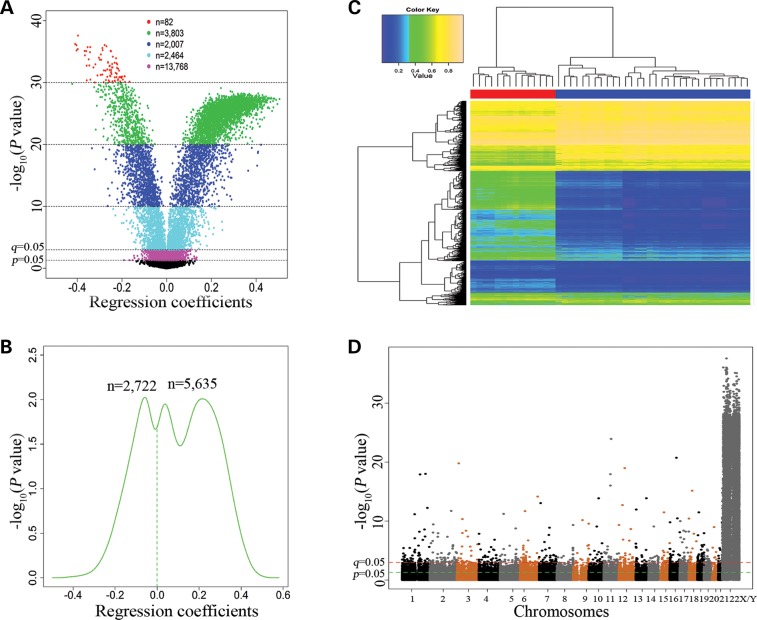
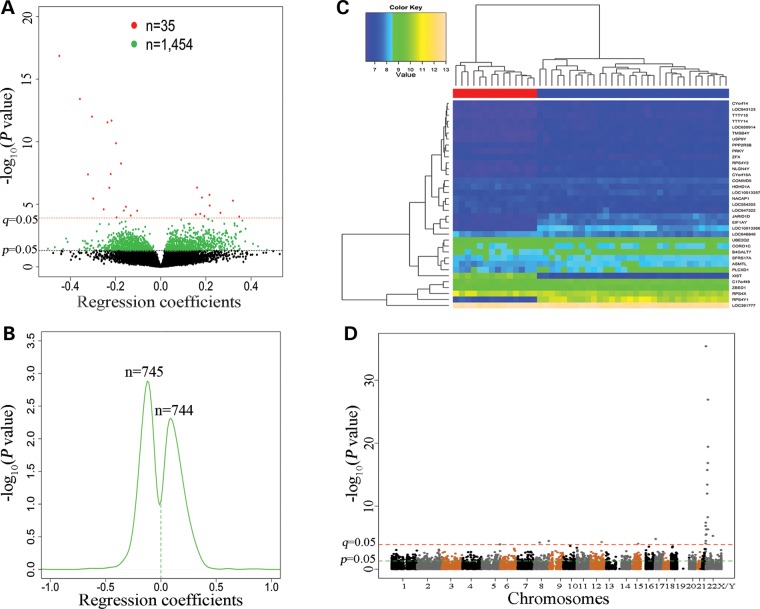
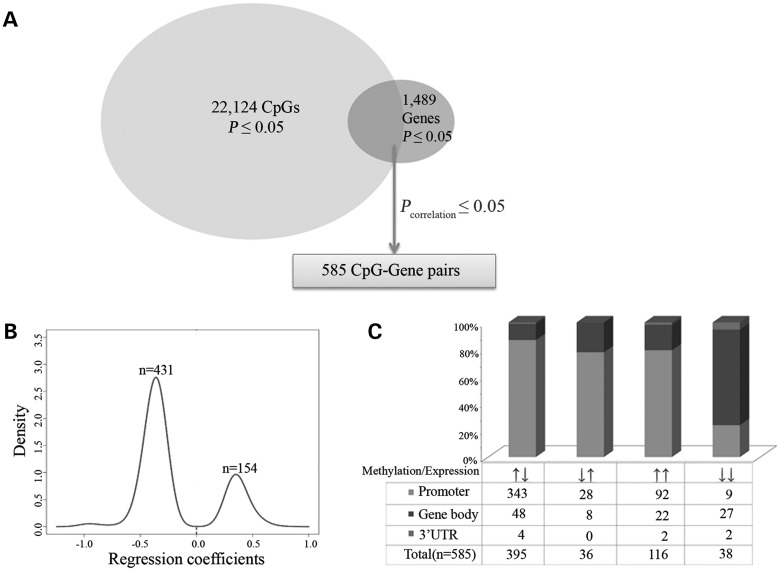
Brain function and cognitive performance differ between men and women in some measures. The phenotypic variation may be partially due to sex differences in epigenomes and transcriptomes in specific brain regions [e.g. the prefrontal cortex (PFC)]. Genome-wide DNA methylation and gene expression were examined in postmortem PFC of 32 males and 14 females (all were Caucasians) using Illumina's 450K Methylation and HT-12 v4 Gene Expression BeadChips, respectively. Multiple linear regression, Pearson correlation and DAVID functional annotation analyses were applied to investigate sex-biased DNA methylation and gene expression, DNA methylation-gene expression correlation and gene ontology (GO) annotations overrepresented by differentially methylated and expressed genes. A total of 22 124 CpGs showed differential methylation between males and females (2.6 × 10(-38) ≤ Pnominal ≤ 0.05), and the P-values of 8357 CpGs withstood multiple-testing correction (q < 0.05). A total of 1489 genes showed differential expression between males and females (4.1 × 10(-36) ≤ Pnominal ≤ 0.05), and the P-values of 35 genes survived multiple-testing correction (q < 0.05). A significant correlation (Pcorrelation < 0.05) was observed between methylation levels of 585 differentially methylated CpGs (Pnominal ≤ 0.05) and expression levels of 188 differentially expressed host genes (Pnominal < 0.05). The GO terms enriched by these 188 genes (134 on autosomes and 54 on sex chromosomes) were assigned to 24 clusters, and 33 genes involved in the top cluster (enrichment score: 4.7) mainly participate in ribosome structure and function, RNA binding and protein translation. This study demonstrated sex-specific methylomic and transcriptomic profiles in the human PFC. Our findings suggest that sex-biased DNA methylation and gene expression could be either the cause or consequence of differential brain development between males and females.


Figures

Figure 1.
Figure 1.
Genome-wide DNA methylation differences between 32 male and 14 female subjects. (A) Volcano plotting of regression coefficients of 430 011 CpGs against -log10(P-values). Regression coefficients were obtained from multiple linear regression analysis. (B) Kernel density estimation of the distributions of regression coefficients of 8357 CpGs (Pnominal < 0.001 or q ≤ 0.05). (C) Hierarchical clustering heatmap was constructed using methylation levels of 8357CpGs (Pnominal < 0.001 or q ≤ 0.05) across the 46 subjects (columns). Colors in the heatmap indicate methylation levels (blue to yellow: low to high methylation levels). The horizontal bars underneath the cluster tree indicate the sex status of the 46 subjects (red color: 14 females; blue color: 32 males). (D) A Manhattan plot showing sex differences in DNA methylation across the genome.
Figure 2.
Figure 2.
Genome-wide gene expression differences between 32 male and 14 female subjects. (A) Volcano plotting of regression coefficients (obtained from multiple linear regression analysis) of 14 851 genes against −log10 (P-values). Red dots represent 35 genes with 4.07 × 10−36Pnominal ≤ 1.13 × 10⁻⁴ (or q ≤ 0.05). Green dots represent 1464 genes with 1.57 × 10⁻⁴Pnominal ≤ 0.05. (B) Kernel density estimation of the distributions of regression coefficients of the above 1489 (35 + 1464) genes (Pnominal ≤ 0.05). (C) Hierarchical clustering heatmap was constructed using methylation levels of 35 genes (rows) (q ≤ 0.05) across the 46 subjects (columns). Colors in the heatmap indicate expression levels (blue to yellow: low to high expression levels). The horizontal bars underneath the cluster tree indicate the sex status of the 46 subjects (red color: 14 females; blue color: 32 males). (D) A Manhattan plot showing sex differences in gene expression across the genome.
Figure 3.
Figure 3.
Sex-associated CpG (methylation)–gene (expression) pairs. (A) One thousand four hundred and three of the 22 124 differentially methylated CpGs (Pnominal ≤ 0.05) were mapped to 547 of the 1489 differentially expressed genes (Pnominal ≤ 0.05), thus generating 1436 CpG (methylation)–gene (expression) pairs [including 585 significant pairs (Pcorrelation ≤ 0.05)]. (B) Density plotting of correlation coefficients (obtained from the Pearson correlation analysis) of the 585 CpG (methylation)–gene (expression) pairs by the Kernel method. (C) Histogram of the 585 sex-specific CpG (methylation)–gene (expression) pairs (Pcorrelation ≤ 0.05). Arrows under the histogram indicate the direction of DNA methylation and gene expression changes in females (e.g. ↑↓ means increased DNA methylation levels but decreased gene expression levels in females) in comparison to males.

References

    1. Gur R.C., Turetsky B.I., Matsui M., Yan M., Bilker W., Hughett P., Gur R.E. Sex differences in brain gray and white matter in healthy young adults: correlations with cognitive performance. J. Neurosci. 1999;19:4065–4072. - PMC - PubMed
    1. Goldstein J.M., Jerram M., Poldrack R., Anagnoson R., Breiter H.C., Makris N., Goodman J.M., Tsuang M.T., Seidman L.J. Sex differences in prefrontal cortical brain activity during fMRI of auditory verbal working memory. Neuropsychology. 2005;19:509–519. - PubMed
    1. Tietjen G.E., Peterlin B.L. Childhood abuse and migraine: epidemiology, sex differences, and potential mechanisms. Headache. 2011;51:869–879. - PMC - PubMed
    1. Qureshi I.A., Mehler M.F. Genetic and epigenetic underpinnings of sex differences in the brain and in neurological and psychiatric disease susceptibility. Prog. Brain Res. 2010;186:77–95. - PMC - PubMed
    1. Bowman R.E., MacLusky N.J., Sarmiento Y., Frankfurt M., Gordon M., Luine V.N. Sexually dimorphic effects of prenatal stress on cognition, hormonal responses, and central neurotransmitters. Endocrinology. 2004;145:3778–3787. - PubMed

Publication types