. 2013 Oct;25(10):3726-42.
doi: 10.1105/tpc.113.115485. Epub 2013 Oct 25.

Nonsense-mediated decay of alternative precursor mRNA splicing variants is a major determinant of the Arabidopsis steady state transcriptome

Affiliations

Nonsense-mediated decay of alternative precursor mRNA splicing variants is a major determinant of the Arabidopsis steady state transcriptome

Gabriele Drechsel et al. Plant Cell. 2013 Oct.

Abstract

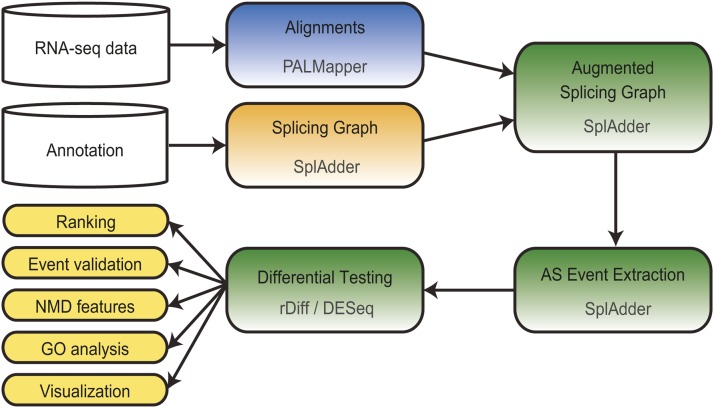
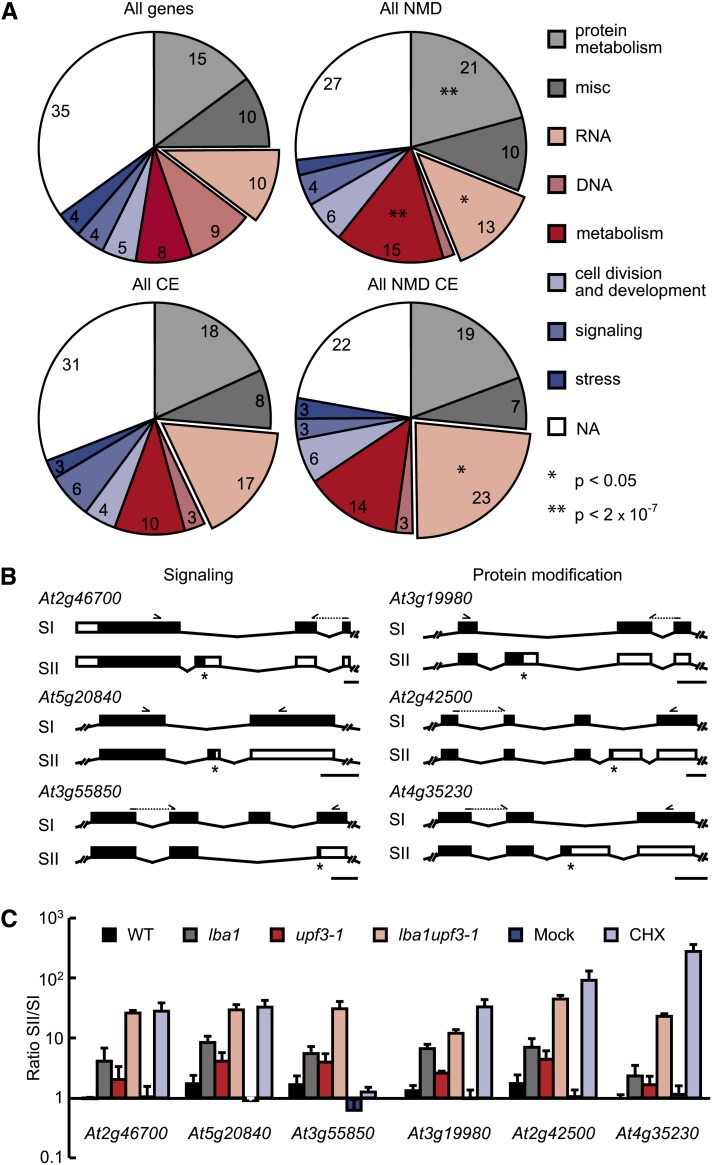
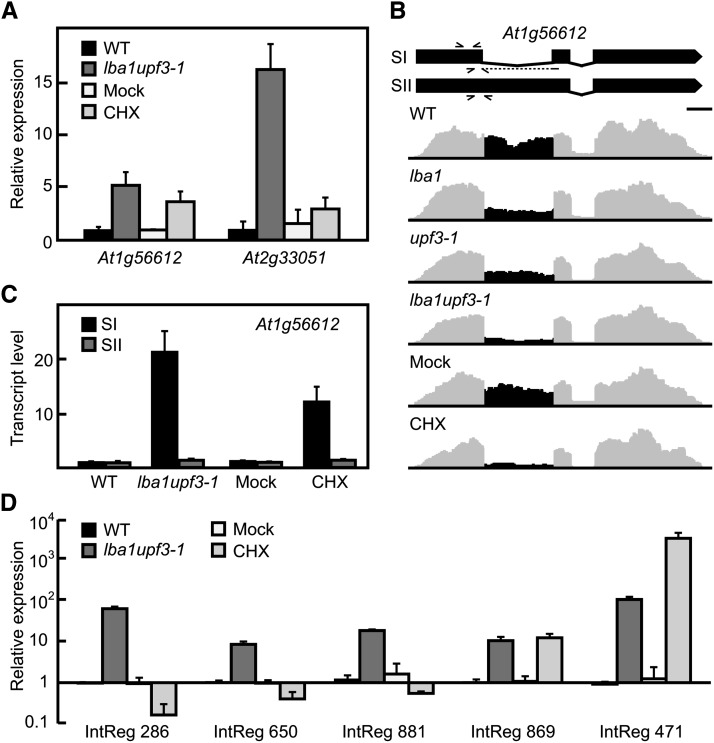
The nonsense-mediated decay (NMD) surveillance pathway can recognize erroneous transcripts and physiological mRNAs, such as precursor mRNA alternative splicing (AS) variants. Currently, information on the global extent of coupled AS and NMD remains scarce and even absent for any plant species. To address this, we conducted transcriptome-wide splicing studies using Arabidopsis thaliana mutants in the NMD factor homologs UP FRAMESHIFT1 (UPF1) and UPF3 as well as wild-type samples treated with the translation inhibitor cycloheximide. Our analyses revealed that at least 17.4% of all multi-exon, protein-coding genes produce splicing variants that are targeted by NMD. Moreover, we provide evidence that UPF1 and UPF3 act in a translation-independent mRNA decay pathway. Importantly, 92.3% of the NMD-responsive mRNAs exhibit classical NMD-eliciting features, supporting their authenticity as direct targets. Genes generating NMD-sensitive AS variants function in diverse biological processes, including signaling and protein modification, for which NaCl stress-modulated AS-NMD was found. Besides mRNAs, numerous noncoding RNAs and transcripts derived from intergenic regions were shown to be NMD responsive. In summary, we provide evidence for a major function of AS-coupled NMD in shaping the Arabidopsis transcriptome, having fundamental implications in gene regulation and quality control of transcript processing.


Figures

Figure 1.
Figure 1.
Double Knockdown of NMD Factors UPF1 and UPF3 Results in a Severe Phenotype and Strong Accumulation of NMD Target RNAs. (A) Phenotypes of the progeny of the indicated Arabidopsis genotypes from seedlings grown for 11 d. Approximately 0.25 of the progeny of lba1−/− upf3-1+/− plants are arrested early in development (circle). (B) PCR-based genotyping of the lines shown in (A). Cleaved-amplified polymorphic sequence analysis (1) allowed distinguishing between the wild type (closed circles) and mutant allele (open circles) for UPF1. For UPF3 (3), two different primer combinations specific for the wild type (WT) and mutant allele (m) were used. M indicates a ladder consisting of DNA fragments in 100-bp increments. (C) Partial gene models and AS variants SI and SII derived from At5g53180, with boxes and lines representing exons and introns, respectively (top). Black boxes show coding regions (according to the representative gene model annotated at TAIR10; SI), the asterisk indicates a translation termination codon, and arrowheads illustrate binding positions of the primers used in RT-PCR (all mutants homozygous). At bottom is a quantitation of the ratio SII:SI using RT-qPCR, normalized to wild-type or control treatment (mock; mean values + sd, n = 3). Bar = 100 nucleotides. (D) Analysis of At4g36960 splicing variants analogous to the description in (C). The coding sequence of a uORF is indicated. The bracket marks additional minor splicing variants.
Figure 2.
Figure 2.
Universal Computational Pipeline for RNA-seq Data Analysis. Comparative analysis of gene expression, isoform expression, and AS patterns based on RNA-seq data from control and NMD-impaired samples. [See online article for color version of this figure.]
Figure 3.
Figure 3.
Transcriptome-Wide Comparison of Splicing Variant Patterns between Control and NMD-Impaired Arabidopsis Seedlings. (A) Size-proportional Venn diagram of significantly altered AS events (with numbers of corresponding genes in parentheses) comparing lba1 upf3-1 and CHX treatment (FDR ≤ 0.1) and lba1 upf3-1 with the two single mutants (double mutant FDR ≤ 0.1; single mutant P ≤ 0.1). Asterisks provide information on statistical significance, and contradictory events with significant changes in opposite directions have been excluded (for numbers, see Supplemental Table 1 online). (B) Relative frequencies of AS types in all detected events as well as for the indicated combinations of NMD impairments: lba1 upf3-1 + CHX (1), changed under both conditions; lba1 upf3-1 + SM – CHX (2), changed in lba1 upf3-1 and in at least one of the single mutants but not upon CHX treatment; all NMD events (3), combination of the two previous sets. alt 5′/3′ ss, Alternative 5′/3′ splice sites. (C) Direction of splicing change for subsets 1, 2, and 3 defined in (B). Direction of change for alternative 5′/3′ splice sites refers to usage of the downstream and upstream splice sites, respectively. (D) Gene models of alternatively spliced regions (top), representative coverage plots (relatively scaled to the same height in all figures) with the altered region in black (middle), and quantitative analysis of splicing variants (bottom) for selected AS events identified by RNA-seq. Splicing variant ratios were determined by Bioanalyzer quantitation (mean values + sd, n = 3). Boxes and lines in gene models represent exons and introns, respectively, with black boxes depicting coding regions (according to the representative gene model annotated at TAIR10; SI). Asterisks indicate translation termination codons, and arrowheads illustrate the binding positions of primers used in RT-PCR. WT, Wild type. Bars = 100 nucleotides.
Figure 4.
Figure 4.
NMD-Responsive Transcripts Are Highly Enriched in Premature Termination Codons. (A) Fractions of positions of AS events as defined by mapping to the corresponding representative TAIR10 model. NA, Not mapable due to the absence of a coding sequence. Analyzed AS event sets are as follows: lba1 upf3-1 + CHX, changed under both conditions; lba1 upf3-1 + SM – CHX, changed in lba1 upf3-1 and in at least one of the single mutants but not upon CHX treatment; all NMD, combination of two previous sets. (B) Presence (+, black bars) or absence (−, white bars) of PTCs or splice junctions more than 50 nucleotides (nts) downstream of the stop codon in transcript variants downregulated or upregulated in NMD-impaired samples (derived from the All NMD set). (C) Analysis of the two splicing variants for the presence/absence of a PTC for all coding sequence–linked AS events altered upon NMD impairment. (D) Median 3′ UTR length of the indicated transcript sets. For the altered events, upregulated and downregulated transcript variants were separately analyzed. (E) Distribution of mean-smoothed 3′ UTR lengths relative to the test P values for lba1 upf3-1 and wild-type transcript isoforms, which were assigned according to their relative increase. Dashed line, FDR = 0.1. (F) Fraction of NMD targets within the top-most protein-coding multiple-exon (PCME) genes relative to coverage for lba1 upf3-1. Under the top 7139 genes with reads per kilobase per million mapped reads (RPKM) ≥ 10, 17.5% are likely NMD targets (dashed line).
Figure 5.
Figure 5.
NMD Targets Are Derived from Genes Linked to Diverse Biological Processes. (A) Distribution of functional groups for all genes (top left), those associated with NMD regulation (top right), all genes with cassette exon (CE) events having experimental support from our wild-type RNA-seq data (bottom left), and genes with NMD-linked cassette exons (bottom right). The two segments without numbers correspond to fractions of 2% each. Significant changes based on a hypergeometrical, Bonferroni-corrected test in comparisons of juxtaposed sets are indicated. NA, not assigned. (B) Gene models of alternatively spliced regions for selected genes of the GO terms signaling (left) and posttranslational protein modification (right). RNA-seq data analysis revealed the presence of NMD-responsive cassette exons in all instances. Boxes and lines represent exons and introns, respectively, with black boxes depicting coding regions (according to the representative gene model annotated at TAIR10; SI). Asterisks indicate translation termination codons, and arrowheads illustrate binding positions of primers used in RT-PCR. Bars = 100 nucleotides. (C) Quantitative analysis of ratios of splicing variants depicted in (B) using Bioanalyzer assays (mean values + sd, n = 3) for control (wild-type [WT] and mock) and NMD-impaired seedlings.
Figure 6.
Figure 6.
NaCl Treatment Alters Splicing Variant Ratios for Genes with Coupled AS-NMD. (A) RT-PCR analysis of splicing variant ratios for the depicted genes from Arabidopsis seedlings treated with mock (−) or NaCl (+) solutions for the indicated durations. Product bands corresponding to the major splicing variants SI and SII (for details, see Figure 5B) are indicated. (B) Quantitative analysis of AS ratios depicted in (A) using Bioanalyzer assays (mean values + sd, n = 3), each normalized to the ratio SII:SI of the control sample at the 0.5-h time point.
Figure 7.
Figure 7.
NMD Targeting of ncRNAs and Transcripts from Intergenic Regions. (A) RT-qPCR analysis of annotated ncRNAs in control and NMD-impaired seedlings (mean values + sd, n = 3 for At2g33051, n = 4 for At1g56612). WT, Wild type. (B) Gene model and representative coverage plots (altered region in black); arrowheads show binding positions of primers used in (A), at top, or (C), below individual transcript models. (C) RT-qPCR analysis of individual splicing variants for At1g56612 (mean values + sd, n = 4). (D) RT-qPCR analysis of total transcript levels for newly identified transcripts in samples from control and NMD-suppressed plants (mean values + sd, n = 3).

Similar articles

Cited by

References

    1. Anders S., Huber W. (2010). Differential expression analysis for sequence count data. Genome Biol. 11: R106. - PMC - PubMed
    1. Arciga-Reyes L., Wootton L., Kieffer M., Davies B. (2006). UPF1 is required for nonsense-mediated mRNA decay (NMD) and RNAi in Arabidopsis. Plant J. 47: 480–489 - PubMed
    1. Azzalin C.M., Lingner J. (2006). The human RNA surveillance factor UPF1 is required for S phase progression and genome stability. Curr. Biol. 16: 433–439 - PubMed
    1. Baek D., Green P. (2005). Sequence conservation, relative isoform frequencies, and nonsense-mediated decay in evolutionarily conserved alternative splicing. Proc. Natl. Acad. Sci. USA 102: 12813–12818 - PMC - PubMed
    1. Behr J., Kahles A., Zhong Y., Sreedharan V.T., Drewe P., Rätsch G. (2013). MITIE: Simultaneous RNA-Seq-based transcript identification and quantification in multiple samples. Bioinformatics 29: 2529–2538 . - PMC - PubMed

Publication types

Associated data