. 2013 Dec 1;191(11):5460-76.
doi: 10.4049/jimmunol.1301576. Epub 2013 Oct 25.

Chronic follicular bronchiolitis requires antigen-specific regulatory T cell control to prevent fatal disease progression

Affiliations

Chronic follicular bronchiolitis requires antigen-specific regulatory T cell control to prevent fatal disease progression

Erica G Schmitt et al. J Immunol. .

Abstract

To study regulatory T (Treg) cell control of chronic autoimmunity in a lymphoreplete host, we created and characterized a new model of autoimmune lung inflammation that targets the medium and small airways. We generated transgenic mice that express a chimeric membrane protein consisting of hen egg lysozyme and a hemoglobin epitope tag under the control of the Clara cell secretory protein promoter, which largely limited transgene expression to the respiratory bronchioles. When Clara cell secretory protein-membrane hen egg lysozyme/hemoglobin transgenic mice were crossed to N3.L2 TCR transgenic mice that recognize the hemoglobin epitope, the bigenic progeny developed dense, pseudo-follicular lymphocytic peribronchiolar infiltrates that resembled the histological pattern of follicular bronchiolitis. Aggregates of activated IFN-γ- and IL-17A-secreting CD4(+) T cells as well as B cells surrounded the airways. Lung pathology was similar in Ifng(-/-) and Il17a(-/-) mice, indicating that either cytokine is sufficient to establish chronic disease. A large number of Ag-specific Treg cells accumulated in the lesions, and Treg cell depletion in the affected mice led to an interstitial spread of the disease that ultimately proved fatal. Thus, Treg cells act to restrain autoimmune responses, resulting in an organized and controlled chronic pathological process rather than a progressive disease.


Figures

Figure 1
Figure 1. Expression of the mHEL/Hb chimeric construct in CCSP-mHEL/Hb mice
(A) The 4.6kB NotI to HindIII fragment of the plasmid used to generate transgenic mice is shown. Nucleotide sequences encoding amino acids 64–76 of mouse Hb βd minor were introduced by PCR into mHEL between amino acids 43 and 44 to generate the chimeric HEL/Hb construct. The clara cell secretory protein (CCSP) promoter was cloned into pBluscript2SK at the BamHI site. The mHEL/Hb construct (HEL/Hb cDNA + the genomic Ld transmembrane region) was subcloned into pBluscript2SK at the unique SmaI site, downstream from CCSP promoter and exons and introns of the rabbit β globin gene. (B)RT-PCR using RNA isolated from the indicated tissues: Br-brain, He-heart, Lu-lung, Li-liver, Co-colon, SI-small intestine, Sp-spleen, Th-thymus, Ki-kidney, Ov-ovary, Sk-skin, SkM-skeletal muscle, MLN-mesenteric lymph node, PLN-peripheral lymph node, MdLN-mediastinal lymph node, (+) Ctl-positive control, MM-master mix control. (C) Frozen lung sections from WT B6.AKR and CCSP-mHEL/Hb mice stained with DAPI (blue), anti-uteroglobin antibody (red), and an antibody specific for HEL (green, F10.6.6), 20× magnification. Scale bar, 100 μM.
Figure 2
Figure 2. Self-reactive T cells escape central tolerance in N3.L2 × CCSP-mHEL/Hb mice
(A,B) Representative flow cytometry from the indicated 8-16 week old mice showing staining of CD4+ T cells with a clonotypic antibody (CAb) that recognizes the N3.L2 TCR. (A) CAb staining in the thymus (n=9,6,11,14, groups 1-4, respectively, at least 6 experiments). (B) CAb staining in the spleen (n=15,19, groups 3 and 4, respectively, at least 6 experiments). (C) Proliferation assay showing CD4+ CAb+ T cells from the lungs of N3.L2 and N3.L2 × CCSP-mHEL/Hb mice that were cultured for 72h with Hb(64-76) peptide and CD3 splenocytes from B6.AKR mice. FACS plots show CellTrace Violet Fluorescence versus EGFP. Numbers indicate the percent of cells dividing in the CD4+ CAb+ gate. Numbers in parentheses indicate the percent of cells dividing in the CD4+ CAb+ EGFP+ or CD4+ CAb+ EGFP gate as indicated (3 experiments). (D) Bar graph showing the proliferation of spleen (top panel) and MdLN (bottom panel) CD4+CAb+EGFP+ or CD4+ CAb+ EGFP cells from the mice in (A). Error bars represent the SEM. (E) Proliferation assay showing CD11b CD11c+ cells isolated by cell sorting from the lungs of CCSP-mHEL/Hb expressing mice (n=3) and control B6.AKR mice (n=2) that were cultured with N3.L2 T cells from N3.L2 Rag−/− mice, plus or minus 10μM Hb(64-76) peptide. FACS plots display CellTrace Violet Fluorescence for cells in the CD4+ gate (2-3 mice pooled per experiment.) (F) RT-PCR using RNA from CD11b CD11c+ cells isolated by cell sorting from the lungs of CCSP-mHEL/Hb expressing mice (n=3, 3 pooled mice). For these and all subsequent representative FACS plots, numbers indicate the mean percent of cells in the quadrant. *p<0.05; **p<0.005
Figure 3
Figure 3. Self-reactive T cells accumulate in the lungs of N3.L2 × CCSP-mHEL/Hb mice
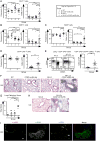
(A-C) Scatter plots showing the percentage (left) and number (right) of CD4+ T cells (A) and CD8+ T cells (B) (n=15,6,14,19, groups 1-4, respectively), and B220+ cells (C) (n=13,4,13,17, groups 1-4, respectively) found in the lung of 8-16 week old control and transgenic mice as indicated (at least 6 experiments). (D) Scatter plots showing the percentage (left) and number (right) of CD4+ CAb+ T cells in the lung of the mice in (A) (n=14, 18, groups 3 and 4, respectively). (E) Representative flow cytometry showing expression of CD44 and CD62L on lung CD4+ CAb+ T cells from N3.L2 and N3.L2 × CCSP-mHEL/Hb mice (left). Scatter plots showing the number (right) of CD4+ CAb+ CD44+ CD62L T cells in the lung of the indicated mice (n=14,17, groups 3 and 4, respectively). (F) Representative H&E stained histological sections from the lungs of control and transgenic mice as indicated, shown at 10× magnification. Scale bar, 100 μM. (G) Total lung inflammation score from 8-18 wk old mice where histology was obtained. The total pathology score (0-9) was based on the sum of three scores, ranging 0-3, for the parameters: bronchiolitis, follicular bronchiolitis, and alveolitis. (H) Representative Masson's Trichrome stained histological sections from the lungs of the indicated transgenic mice, shown at 10× magnification. Scale bar, 100 μM. (I) Frozen sections from the lungs of N3.L2 × CCSP-mHEL/Hb mice stained with an antibody specific for HEL (red), B220 (green), and CD3 (blue), shown at 20× magnification. Scale bar, 100 μM. For these and all subsequent scatter plots, each symbol represents an individual mouse, and the horizontal bars represent mean values ±SEM.
Figure 4
Figure 4. Self-reactive CD4+T cells in the lungs of N3.L2 × CCSP-mHEL/Hb mice produce pro-inflammatory cytokines
(A) Representative intracellular cytokine staining of ex vivo stimulated cells isolated from the lungs of the indicated mice. Staining for IFN-γ and IL-17A in the CD4+ CAb+ gate is shown (n=12,15, groups 3 and 4, respectively, at least 9 experiments). (B) Scatter plots showing the frequency (left) and number (right) of CD4+ CAb+ cells that are IFN-γ+ in the lungs of the mice in (A). (C) Scatter plots showing the frequency (left) and number (right) of CD4+ CAb+ cells that are IL-17A+ in the lungs of the mice in (A). (D) Serum levels of IL-6 and IFN-γ, from the indicated mice (n=3,3,5,8, groups 1-4, respectively).
Figure 5
Figure 5. N3.L2 × CCSP-mHEL/Hb mice deficient in IFN-γ or IL-17A
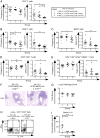
(A-C) Scatter plots showing the percentage (left) and number (right) of CD4+ T cells (A) (n=19,6,11, groups 1-3, respectively), CD8+ T cells (B) (n=19,6,11, groups 1-3, respectively), and B220+ B cells (C) (n=17,6,11, groups 1-3, respectively) found in the lungs of 8-16 week old N3.L2 × CCSP-mHEL/Hb mice (group 1, included for comparison) compared to N3.L2 × CCSP-mHEL/Hb mice deficient in IFN-γ (group 2) or IL-17A (group 3) (4 experiments). (D) Scatter plots showing the percentage (left) and number (right) of CD4+ CAb+ T cells in the lungs of the mice in A (n=18,6,11, groups 1-3, respectively). (E) Scatter plots showing the percentage of CD4+ CAb+ CD44+ CD62L T cells in the lungs of the indicated mice (n=17,6,11, groups 3-5, respectively). (F) Representative H&E stained histological sections from the lungs of the indicated transgenic mice, shown at 10× magnification. Scale bar, 100 μM. (G)Total lung inflammation score from 8-20 wk old mice where histology was obtained. (H) Representative intracellular cytokine staining of ex vivo stimulated cells isolated from the lungs of the indicated mice. Staining for IFN-γ and IL-17A in the CD4+ CAb+ gate is shown (n=6,6, 3-4 experiments).(I) Scatter plot showing the serum levels of IL-6 from the indicated mice (n=8,3,3, groups 1-3, respectively). *p<0.05; p<0.0005
Figure 6
Figure 6. Regulatory T cells accumulate in N3.L2 × CCSP-mHEL/Hb mice
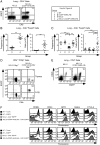
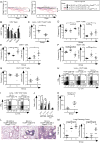
(A) Representative flow cytometry showing CAb versus Foxp3-EGFP fluorescence in the lung CD4+ T cells of control and bigenic mice (n=14,18, groups 3 and 4, respectively, at least 11 experiments). (B) Scatter plots showing the percent (left) and number (right) of CD4+ cells that are CAb+ Foxp3+ from the lung of the mice in (A). (C) Scatter plots showing the percent (left) and number (right) of CD4+ cells that are CAb Foxp3+ from the lung of the mice in (A) and control mice (n=8,6, groups 1 and 2 respectively, at least 4 experiments). (D) Flow cytometry showing CAb versus Foxp3-EGFP fluorescence in the thymus (top panels) and lung (bottom panels) CD4+ T cells of control and bigenic mice on the Rag−/− background (n=4,6, left to right, 3 experiments). (E) Representative flow cytometry gated on CD4+ T cells showing Foxp3-EGFP fluorescence versus CD25 in the lungs of control and bigenic mice (n=11,11, left to right). (F) Representative flow cytometric staining of CD4+ CAb+ Foxp3-EGFP+ (top) and CD4+ CAb Foxp3-EGFP+ (bottom) T cells from the lung of N3.L2, and N3.L2 × CCSP-mHEL/Hb mice. Control B6.AKR mice CD4+ CAb Foxp3-EGFP (black) and CD4+ CAb Foxp3-EGFP+ (gray) staining is included for comparison, stained as indicated (n=4, 4 experiments).
Figure 7
Figure 7. Kinetics of disease progression in N3.L2 × CCSP-mHEL/Hb mice
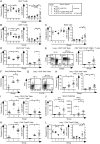
(A-C) Scatter plots showing the percentage (left) and number (right) of CD4+ T cells (A) (n=7,4,6,6,19, groups 1-5, respectively), CD8+ T cells (B) (n=7,4,6,6,19, groups 1-5, respectively), and B220+ cells (C) (n=6,3,5,4,17, groups 1-5, respectively) found in the lungs of control and transgenic mice that were <8wk old, as indicated (at least 3 experiments). The values from 8-16 wk old N3.L2 × CCSP-mHEL/Hb mice are included for comparison (group 5) in these and the following scatter plots. (D) Scatter plots showing the percentage (left) and number (right) of CD4+ CAb+ T cells in the lungs of the mice in (A) (n=5,4,18, groups 3-5, respectively). (E) Representative flow cytometry showing the expression of CD44 and CD62L on lung CD4+ CAb+ T cells from N3.L2 and N3.L2 × CCSP-mHEL/Hb mice <8wk old (left). Scatter plot showing the number (right) of CD4+ CAb+ CD44+ CD62L T cells in the lungs of the indicated mice (n=5,3,17, groups 3-5, respectively). (F) Total lung inflammation score from <8 wk old mice where histology was obtained. Scores from 8-16 wk old N3.L2 × CCSP-mHEL/Hb mice are included for comparison. (G) Representative intracellular cytokine staining of ex vivo stimulated cells isolated from the lungs of the indicated mice. Staining for IFN-γ and IL-17A in the CD4+ CAb+ gate is shown (n=6,6, groups 3 and 4, respectively, 5 experiments). (H) Scatter plots showing the frequency (left) and number (right) of CD4+ CAb+ cells that are IFN-γ in the lungs of the mice in (D). (I) Scatter plots showing the frequency (left) and number (right) of CD4+ CAb+ cells that are IL-17+ in the lungs of the mice in (D). (J) Serum levels of IL-6 and IFN-γ, from the indicated mice (n=5,6,8, groups 3-5, respectively). (K) Scatter plots showing the percent (left) and number (right) of CD4+ cells that are CAb+ Foxp3+ from the lungs of the mice in (A) (n=5,4, groups 3 and 4, respectively, 4 experiments). (L) Scatter plots showing the percent (left) and number (right) of CD4+ cells that are CAb Foxp3+ from the lungs of the mice in (G) and control mice (n=6,4, groups 1 and 2 respectively, 4 experiments). *p<0.05; **p<0.005
Figure 8
Figure 8. Regulatory T cells control disease progression in N3.L2 × CCSP-mHEL/Hb mice
(A) Linear regression analysis of the weight change over time following DT administration to control B6.AKR × Foxp3DTR mice or CCSP-mHEL/Hb × Foxp3DTR mice (gray, n=8, 2 experiments), N3.L2 × CCSP-mHEL/Hb mice (black, n=9, 3 experiments) and experimental N3.L2 × CCSP-mHEL/Hb × Foxp3DTR mice (red, n=7, 3 experiments). Dashed lines represent individual mice and solid lines indicate a line fit to the data. DT was administered every other day. Weight loss was monitored and mice were sacrificed when they became moribund or lost ∼20% of their baseline bodyweight (12 injection maximum). Control mice were sacrificed with paired experimental mice or after the average number of injections received by experimental mice (9 injections). (B) Bar graph showing the frequency of CD4+ cells that are EGFP+ in the lung, mediastinal lymph node (MdLN), peripheral lymph node (PLN), and spleen of the mice in A. Error bars represent the SEM. (C) Scatter plots showing the percent of CD4+ cells that are CAb+ Foxp3+ from the lungs of the mice in (A) (n=5,7, groups 2 and 3, respectively). (E-F) Scatter plots showing the percentage (left) and number (right) of CD4+ T cells (D), CD8+ T cells (E), and B220+ B cells (F) found in the lung of control and experimental mice as indicated (n=8,5,7, groups 1-3, respectively). (G) Scatter plots showing the percentage (left) and number (right) of CD4+ CAb+ T cells in the lung of the mice in A. (H) Representative intracellular cytokine staining of ex vivo stimulated cells isolated from the lungs of the indicated mice. Staining for IFN-γ and IL-17A in the CD4+ gate is shown (n=8,7,5, left to right, 2 experiments). (I) Representative intracellular cytokine staining of ex vivo stimulated cells isolated from the lungs of the indicated mice. Staining for IFN-γ and IL-17A in the CD4+ CAb+ gate is shown (n=7,5, left to right, 2 experiments). (J) Bar graph showing the number of CD4+ and CD4+ CAb+ cells that are IFN-γ or IL-17A+ in the lungs of the mice in E and F. (K) Scatter plot showing the serum levels of IL-6 from the indicated mice (n=4,5, groups 2 and 3, respectively). (L) Representative H&E stained histological sections from the lungs of control and Treg cell-depleted mice as indicated, shown at 10× magnification. Scale bar, 100 μM. (M) Total lung inflammation score (0-9) from control and Treg cell-depleted mice where histology was obtained (left). Alveolitis score (0-3) from control and Treg cell-depleted mice (right). *p<0.05; **p<0.005; ***p<0.0005

Similar articles

Cited by

References

    1. Sakaguchi S, Sakaguchi N, Asano M, Itoh M, Toda M. Immunologic self-tolerance maintained by activated T cells expressing IL-2 receptor alpha-chains (CD25). Breakdown of a single mechanism of self-tolerance causes various autoimmune diseases. J Immunol. 1995;155:1151–1164. - PubMed
    1. Brunkow ME, Jeffery EW, Hjerrild KA, Paeper B, Clark LB, Yasayko SA, Wilkinson JE, Galas D, Ziegler SF, Ramsdell F. Disruption of a new forkhead/winged-helix protein, scurfin, results in the fatal lymphoproliferative disorder of the scurfy mouse. Nat Genet. 2001;27:68–73. - PubMed
    1. Chatila TA, Blaeser F, Ho N, Lederman HM, Voulgaropoulos C, Helms C, Bowcock AM. JM2, encoding a fork head-related protein, is mutated in X-linked autoimmunity-allergic disregulation syndrome. J Clin Invest. 2000;106:R75–81. - PMC - PubMed
    1. Bennett CL, Christie J, Ramsdell F, Brunkow ME, Ferguson PJ, Whitesell L, Kelly TE, Saulsbury FT, Chance PF, Ochs HD. The immune dysregulation, polyendocrinopathy, enteropathy, X-linked syndrome (IPEX) is caused by mutations of FOXP3. Nat Genet. 2001;27:20–21. - PubMed
    1. Wildin RS, Ramsdell F, Peake J, Faravelli F, Casanova JL, Buist N, Levy-Lahad E, Mazzella M, Goulet O, Perroni L, Bricarelli FD, Byrne G, McEuen M, Proll S, Appleby M, Brunkow ME. X-linked neonatal diabetes mellitus, enteropathy and endocrinopathy syndrome is the human equivalent of mouse scurfy. Nat Genet. 2001;27:18–20. - PubMed

Publication types

MeSH terms