. 2014 Mar;68(3):772-790.
doi: 10.1111/evo.12302. Epub 2013 Nov 25.

Phenotypic and genotypic convergences are influenced by historical contingency and environment in yeast

Affiliations

Phenotypic and genotypic convergences are influenced by historical contingency and environment in yeast

Aymé Spor et al. Evolution. 2014 Mar.

Abstract

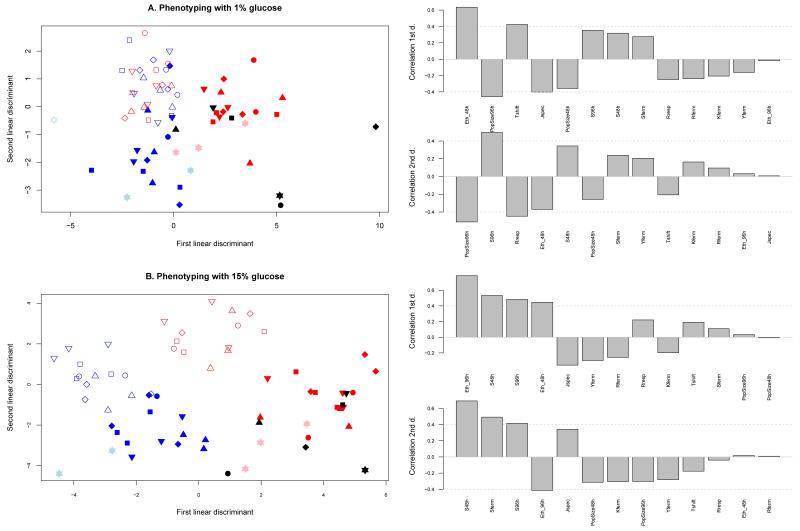
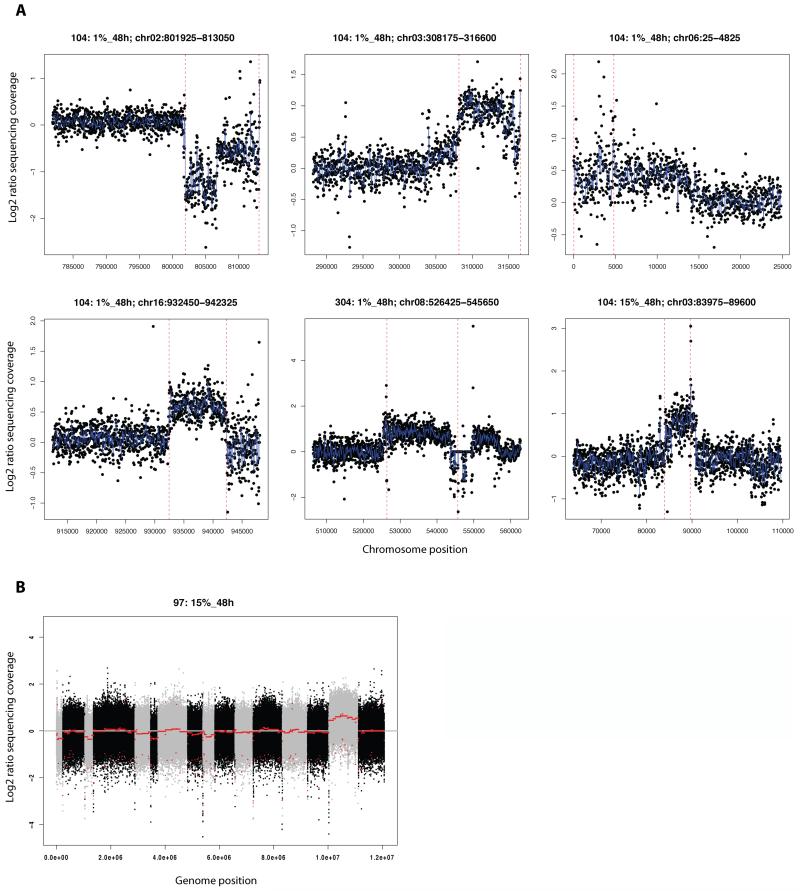
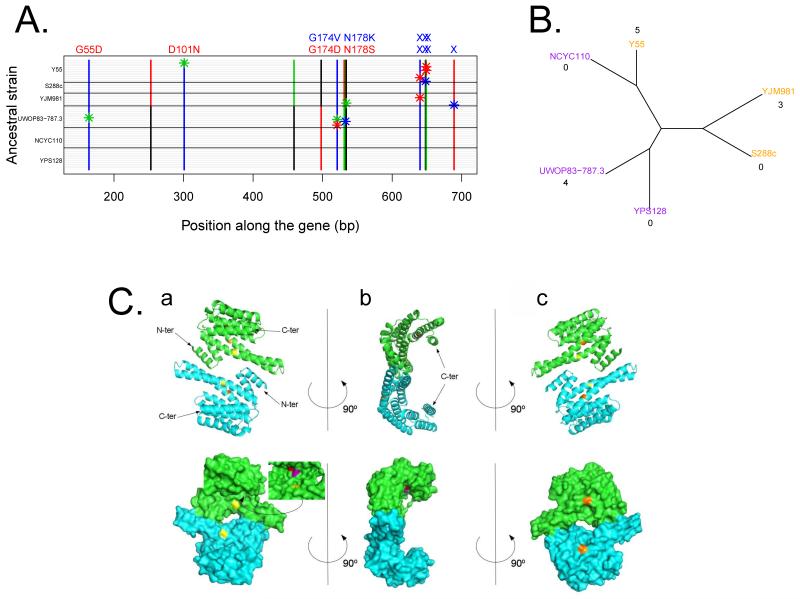
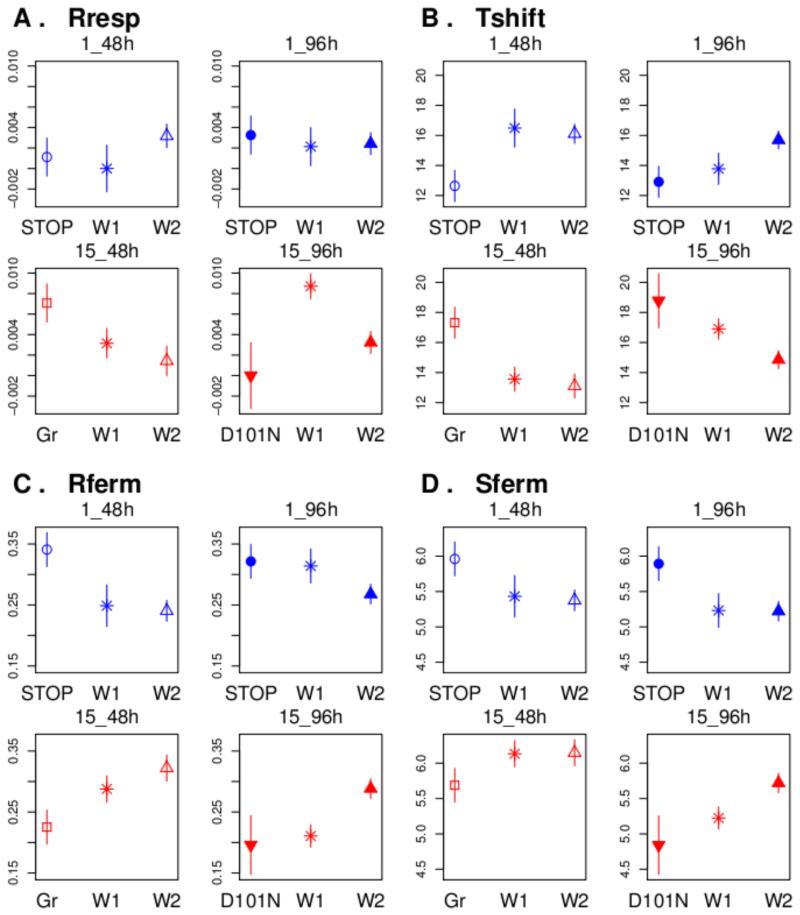
Different organisms have independently and recurrently evolved similar phenotypic traits at different points throughout history. This phenotypic convergence may be caused by genotypic convergence and in addition, constrained by historical contingency. To investigate how convergence may be driven by selection in a particular environment and constrained by history, we analyzed nine life-history traits and four metabolic traits during an experimental evolution of six yeast strains in four different environments. In each of the environments, the population converged toward a different multivariate phenotype. However, the evolution of most traits, including fitness components, was constrained by history. Phenotypic convergence was partly associated with the selection of mutations in genes involved in the same pathway. By further investigating the convergence in one gene, BMH1, mutated in 20% of the evolved populations, we show that both the history and the environment influenced the types of mutations (missense/nonsense), their location within the gene itself, as well as their effects on multiple traits. However, these effects could not be easily predicted from ancestors' phylogeny or past selection. Combined, our data highlight the role of pleiotropy and epistasis in shaping a rugged fitness landscape.

Keywords: 14-3-3 protein; Adaptive landscape; experimental evolution; life-history evolution; pleiotropy.


Figures

Figure 1
Figure 1. Canonical plots of the linear discriminant analysis
A. Phenotypic evaluation of ancestral strains and evolved populations in the 1 % glucose medium. B. Phenotypic evaluation of ancestral strains and evolved populations in the 15 % glucose medium. The correlations between traits and how they explain the linear discriminant axis are presented on the right. The colors of the symbols correspond to the different selection regimes (empty blue: 1%_48h, filled blue: 1%_96h, empty red: 15%_48h and filled red: 15%_96h). The black symbols correspond to the ancestral strains. The shapes of the symbols correspond to the evolved and ancestral state of a given strain (stars for S288c, down triangle for Y55, up triangle for YPS128, diamond for NCYC110, square for UWOPS83-787.3, and circle for YJM981).
Figure 2
Figure 2. Copy Number Variants (CNVs) identified by sequencing coverage of the evolved strain versus the ancestral strain
A) Zoomed-in coverage plots of each sub-chromosomal CNV. Red-dotted lines delimit the regions identified as CNVs by DNAcopy. Blue line is a running median of log2 ratios. B) Whole-genome coverage plot for the 97: 15%_48h evolved strain showing duplication of chromosome 15. Alternating grey/black colors are chromosomes. Red line is a running median of log2 ratios.
Figure 3
Figure 3. Polymorphism in the BMH1 gene and encoded protein
A) Each grey horizontal line represents the allele sequence of a clone isolated from a population after evolution. The ancestral strain is shown on the left. Polymorphic sites are shown with vertical lines. Nucleotides are indicated with color (T in red, A in green, C in blue, G in black). Bars represent the ancestral allele and stars show mutations that had occurred along the evolutionary course. Corresponding changes in the protein are indicated on top of the nucleotide mutations. Crosses are stop mutations. Amino-acid substitutions are indicated by their position in the protein. Mutations that have occurred in 1% selection regimes are indicated in blue, mutations that have occurred in 15% selection regimes in red. B) Neighbor-joining tree based on the proportion of different nucleotides between genomes of the six ancestral strains. The BMH1 allele is indicated by the color of the strain’s name (orange or purple). The number of mutations that has occurred in BMH1 during the course of evolution is indicated below the name of each strain. C) Model of dimeric Bmh1p (region 1 to 235). A: front view, B: side view, C: back view, top row: cartoon representation, bottom row : surface representation. The two chains composing the dimer are shown in different colors (cyan and green). The positions affected by the mutation are highlighted in colors: position 55 in yellow, position 101 in orange, position 174 in red and position 178 in purple.
Figure 4
Figure 4. Effect of Bmh1p mutations in each selection regime where the mutations had occurred as evaluated in 15% glucose medium
W indicates evolved populations that have kept their ancestral protein sequences (W1 or W2), Gr indicates evolved populations that have had a substitution pointing on the groove of the protein, STOP indicates evolved populations having a truncated protein.

References

    1. Aitken A. 14-3-3 proteins: A historic overview. Seminars in Cancer Biology. 2006;16:162–172. - PubMed
    1. Albertin W, Marullo P, Aigle M, Dillmann C, de Vienne D, Bely M, Sicard D. Population Size Drives Industrial Saccharomyces cerevisiae Alcoholic Fermentation and Is under Genetic Control. Applied and Environmental Microbiology. 2011;77:2772–2784. - PMC - PubMed
    1. Araya C, Payen C, Dunham M, Fields S. Whole-genome sequencing of a laboratory-evolved yeast strain. BMC genomics. 2010;11:88. - PMC - PubMed
    1. Arendt J, Reznick D. Convergence and parallelism reconsidered: what have we learned about the genetics of adaptation? Trends in Ecology & Evolution. 2008;23:26–32. - PubMed
    1. Arnold SJ, Pfrender ME, Jones AG. The adaptive landscape as a conceptual bridge between micro-and macroevolution. Genetica. 2001;112:9–32. - PubMed

Publication types

Substances

Associated data