. 2014 Mar;141(3):388-400.
doi: 10.1111/imm.12201.

CD49a promotes T-cell-mediated hepatitis by driving T helper 1 cytokine and interleukin-17 production

Affiliations

CD49a promotes T-cell-mediated hepatitis by driving T helper 1 cytokine and interleukin-17 production

Yonglin Chen et al. Immunology. 2014 Mar.

Abstract

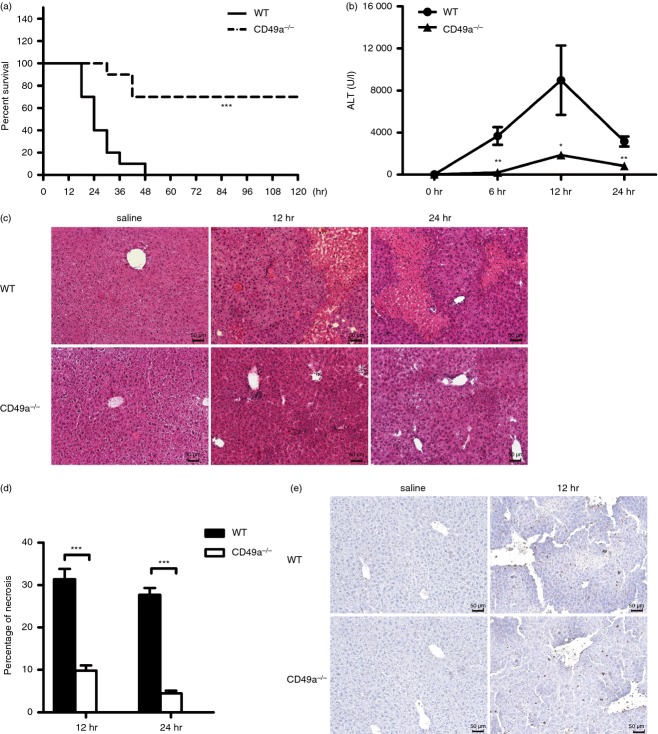
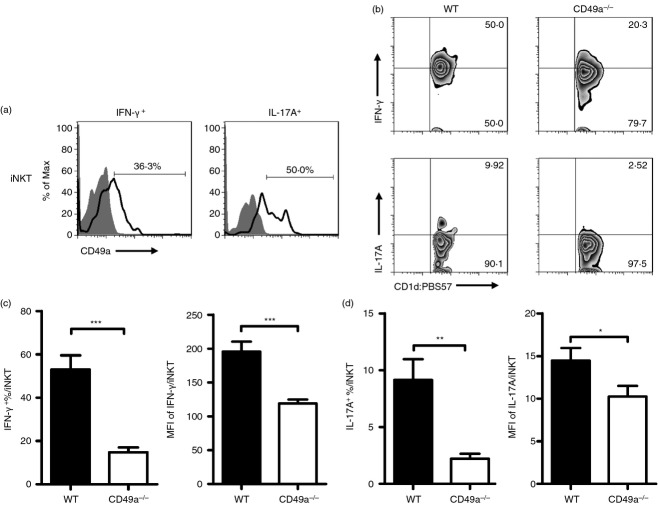
It is becoming increasingly clear that the T-cell-mediated immune response is important in many diseases. In this study, we used concanavalin A (Con A) -induced hepatitis to investigate the role of CD49a in the molecular and cellular mechanism of the T-cell-mediated immune response. We found that CD49a(-/-) mice had significantly reduced levels of serum alanine aminotransferase and were protected from Con A-induced hepatitis. CD49a deficiency led to decreased production of interferon-γ (IFN-γ) and interleukin-17A (IL-17A) after Con A injection. Furthermore, we found that hepatic CD4(+) T cells and invariant natural killer T cells up-regulated CD49a expression, along with enhanced activation after Con A injection, leading to production of inflammatory cytokines by these T cells. Blockade of CD49a in vivo ameliorated Con A-induced hepatitis with reduced production of IFN-γ and IL-17A. Hence, CD49a promoted Con A-induced hepatitis through enhancing inflammatory cytokine production (IFN-γ and IL-17A) by CD4(+) T and invariant natural killer T cells. The protective effect of CD49a blockade antibody suggested a new target therapeutic molecule for intervention of T-cell-mediated liver injury.

Keywords: CD49a; T-cell-mediated hepatitis; interferon-γ; interleukin-17A.


Figures

Figure 1
Figure 1
CD49a deficiency ameliorates concanavalin A (Con A) -induced hepatitis. (a) Survival of wild-type and CD49a−/− mice after injection with a lethal dose of Con A (25 μg/g). Survival was monitored every 6 hr. Data show the combined results from two experiments, n = 10 per group. (b) Serum alanine aminotransferase (ALT) levels of wild-type (n = 7 or n = 8) and CD49a−/− (n = 7 or n = 8) mice 24 hr after intravenous injection of Con A (12 μg/g). Data show the combined results from two experiments (mean ± SEM; *< 0·05; **< 0·01). (c) Representative photomicrographs of haematoxylin & eosin-stained liver sections from wild-type and CD49a−/− mice 12 and 24 hr after Con A injection. Black scale bars represent 50 μm. (d) The percentage of the necrotic area in the livers of wild-type and CD49a−/− mice 12 and 24 hr after Con A treatment (12 μg/g). The percentage of the necrotic area was measured from three different fields for each mouse (n = 7 or n = 8 mice/group; mean ± SEM; ***< 0·001). (e) Representative photomicrographs of liver sections stained with anti-CD45 (brown) from wild-type and CD49a−/− mice 12 hr after Con A injection (12 μg/g). Black scale bars represent 50 μm.
Figure 2
Figure 2
Serum interferon-γ (IFN-γ) and interleukin-17A (IL-17A) levels decrease in CD49a−/− mice after concanavalin A (Con A) injection. Wild-type (n = 6–10) and CD49a−/− mice (n = 6–10) were intravenously injected with Con A (12 μg/g). The serum levels of IFN-γ (a), IL-17A (b), tumour necrosis factor-α (TNF-α) (c), IL-4 (d), IL-10 (e), IL-2 (f) and IL-6 (g) in wild-type (black bars) and CD49a−/− (white bars) mice were detected by ELISA at the indicated time-points (6 and 12 hr) after Con A injection. Data show the combined results from two experiments (mean ± SEM; *< 0·05).
Figure 3
Figure 3
CD49a deficiency decreases production of inflammatory cytokines in vitro. (a) Representative Western blotting of type IV collagen in the livers of untreated wild-type and CD49a−/− mice. n = 3 per group. (b) Liver mononuclear cells were prepared from untreated wild-type (black bars) and CD49a−/− mice (white bars). Cells were stimulated with concanavalin A (Con A) for 24 hr in 96-well plates pre-coated with type IV collagen. Culture supernatants were collected and assayed for interferon-γ (IFN-γ) and interleukin-17A (IL-17A) production by ELISA. Data are expressed as the mean ± SEM from quintuplicate samples (***< 0·001). Data are representative of two independent experiments. (c) Liver mononuclear cells were isolated from untreated wild-type (black bars) and CD49a−/− mice (white bars) and cultured under T helper type 1 (Th1) or Th17 cell-polarizing conditions in the presence of anti-CD3/28 antibodies for 72 hr in 96-well plates pre-coated with type IV collagen. Data are expressed as the mean ± SEM from quadruplicate samples (***< 0·001). Data are representative of two independent experiments.
Figure 4
Figure 4
CD49a deficiency does not influence mononuclear cell infiltration. Wild-type and CD49a−/− mice were intravenously injected with concanavalin A (Con A) (12 μg/g). Liver mononuclear cells were isolated 6 hr after injection. Absolute numbers of invariant natural killer T (iNKT) (CD1d tetramer+ CD3int), CD4+ T (CD1d tetramer CD3hi CD4+), CD8+ T (CD3hi CD8+), NK (NK1.1+ CD3), B (CD19+ CD3), macrophage (CD11b+ F4/80+) and inflammatory monocytes (IM) (CD11b+ Ly6Chi) cells in the livers of wild-type (n = 8, black bars) versus CD49a−/− (n = 7–8, white bars) mice were calculated. Data show the combined results from two experiments (mean ± SEM).
Figure 5
Figure 5
CD49a expression on hepatic CD4+ T cells during concanavalin A (Con A) -induced hepatitis. (a) CD49a expression on liver CD4+ T (CD1d tetramer CD3hi CD4+) cells from untreated wild-type and CD49a−/− mice. Data are representative of two independent experiments, n = 8 per group. Grey-filled curves, isotype control. (b) CD49a expression on liver CD4+ T (CD1d tetramer CD3hi CD4+) cells from saline-treated (black solid line) or Con A-treated (12 μg/g, dashed line) wild-type mice 6 hr post-injection. Data are representative of two independent experiments, n = 8 per group. Grey-filled curves, isotype control. (c) Absolute number of CD49a+ CD4+ T (CD49a+ CD1d tetramer CD3hi CD4+) cells in the livers of saline-treated (white bar) or Con A-treated (12 μg/g, black bar) wild-type mice 6 hr after injection. Data show the combined results from two experiments, n = 8 per group (mean ± SEM; *< 0·05). (d) Expression of CD69 and CD25 on hepatic CD4+ T (CD1d tetramer CD3hiCD4+) cells from wild-type (black solid line) and CD49a−/− mice (dashed line) 6 hr after Con A injection (12 μg/g). Data are representative of two independent experiments, n = 8–9 per group. Grey-filled curves, isotype control.
Figure 6
Figure 6
Decreased production of CD4+ T-cell-derived interferon-γ (IFN-γ) and interleukin-17A (IL-17A) in CD49a−/− mice. Wild-type and CD49a−/− mice were intravenously injected with concanavalin A (Con A) (12 μg/g). Liver mononuclear cells were isolated 12 hr after Con A treatment. (a) CD49a expression on liver IFN-γ+ CD4+ T (IFN-γ+ CD1d tetramer CD3hi CD4+, left) cells and IL-17A+ CD4+ T (IL-17A+ CD1d tetramer CD3hi CD4+, right) cells from wild-type mice. Data are representative of two independent experiments, n = 6 per group. Grey-filled curves, isotype control. (b) Intracellular staining of IFN-γ and IL-17A in liver CD4+ T (CD1d tetramer CD3hi CD4+) cells. Numbers indicate percentages. (c) Statistical analysis of the percentage of IFN-γ+ cells (left) and mean fluorescence intensity (MFI) of IFN-γ (right) in liver CD4+ T (CD1d tetramer CD3hi CD4+) cells. (d) Statistical analysis of the percentage of IL-17A+ cells (left) and MFI of IL-17A (right) in liver CD4+ T (CD1d tetramer CD3hi CD4+) cells. Data show the combined results from two experiments, n = 8 per group (mean ± SEM; **< 0·01; ***< 0·001).
Figure 7
Figure 7
CD49a expression on hepatic invariant natural killer T (iNKT) cells during concanavalin A (Con A) -induced hepatitis. (a) CD49a expression on liver iNKT (CD1d tetramer+ CD3int) cells from untreated wild-type and CD49a−/− mice. Data are representative of two independent experiments, n = 8 per group. Grey-filled curves, isotype control. (b) CD49a expression on liver iNKT (CD1d tetramer+ CD3int) cells from saline-treated (black solid line) or Con A-treated (12 μg/g, dashed line) wild-type mice 6 hr post-injection. Data are representative of two independent experiments, n = 8 per group. Grey-filled curves, isotype control. (c) Expression of Fas ligand and TRAIL on liver iNKT (CD1d tetramer+ CD3int) cells from wild-type mice (black solid line) and CD49a−/− mice (dashed line) 6 hr after Con A injection (12 μg/g). Data are representative of two independent experiments, n = 9 per group. Grey-filled curves, isotype control.
Figure 8
Figure 8
Invariant natural killer T (iNKT) -cell-derived interferon-γ (IFN-γ) and interleukin-17A (IL-17A) are reduced in CD49a−/− mice. Wild-type mice (black bars) and CD49a−/− mice (white bars) were intravenously injected with concanavalin A (Con A) (12 μg/g). Liver mononuclear cells were isolated 12 hr after Con A treatment. (a) CD49a expression on liver IFN-γ+ iNKT (IFN-γ+ CD1d tetramer+ CD3int, left) cells and IL-17A+ iNKT (IL-17A+ CD1d tetramer+ CD3int, right) cells from wild-type mice. Data are representative of two independent experiments, n = 6 per group. Grey-filled curves, isotype control. (b) Intracellular staining of IFN-γ and IL-17A in liver iNKT (CD1d tetramer+ CD3int) cells. Numbers indicate percentages. (c) Statistical analysis of the percentage of IFN-γ+ cells (left) and mean fluorescence intensity (MFI) of IFN-γ (right) in liver iNKT (CD1d tetramer+ CD3int) cells. (d) Statistical analysis of the percentage of IL-17A+ cells (left) and MFI of IL-17A (right) in liver iNKT (CD1d tetramer+ CD3int) cells. Data show the combined results from two experiments, n = 8 per group (mean ± SEM; *< 0·05; **< 0·01; ***< 0·001).
Figure 9
Figure 9
Blockade of CD49a attenuates concanavalin A (Con A) -induced liver injury. Wild-type mice were pretreated with 100 μg of either isotype antibody (black bars) or anti-CD49a monoclonal antibody (Ha31/8, white bars) per mouse 24 hr before Con A (12 μg/g) injection. Blood and liver tissues were collected 12 hr after Con A injection. (a) Serum alanine aminotransferase (ALT) levels were detected. (b) Representative photomicrographs of haematoxylin & eosin (H&E) -stained liver sections. Black scale bars represent 50 μm. (c) The percentage of the necrotic area in the livers 12 hr after Con A treatment was calculated by analysing H&E-stained sections. The percentage of necrotic area was measured from three different fields for each mouse (n = 9 mice/group). (d) Serum interferon-γ (IFN-γ) levels were detected by ELISA. (e) Serum interleukin-17A (IL-17A) levels were detected by ELISA. Data show the combined results from two experiments, n = 9 per group (mean ± SEM; *< 0·05,***< 0·001).

Similar articles

Cited by

References

    1. Tiegs G, Hentschel J, Wendel A. A T cell-dependent experimental liver injury in mice inducible by concanavalin A. J Clin Invest. 1992;90:196–203. - PMC - PubMed
    1. Zhang S, Liang R, Luo W, et al. High susceptibility to liver injury in IL-27 p28 conditional knockout mice involves intrinsic interferon-γ dysregulation of CD4+ T cells. Hepatology. 2012;57:1620–31. - PubMed
    1. Takeda K, Hayakawa Y, Kaer Van L, Matsuda H, Yagita H, Okumura K. Critical contribution of liver natural killer T cells to a murine model of hepatitis. Proc Natl Acad Sci U S A. 2000;97:5498–503. - PMC - PubMed
    1. Kaneko Y, Harada M, Kawano T, Yamashita M, Shibata Y, Gejyo F, Nakayama T, Taniguchi M. Augmentation of Vα14 NKT cell-mediated cytotoxicity by interleukin 4 in an autocrine mechanism resulting in the development of concanavalin A-induced hepatitis. J Exp Med. 2000;191:105–14. - PMC - PubMed
    1. Lafdil F, Wang H, Park O, et al. Myeloid STAT3 inhibits T cell-mediated hepatitis by regulating T helper 1 cytokine and interleukin-17 production. Gastroenterology. 2009;137:2125–35. e1.2. - PMC - PubMed

Publication types

MeSH terms