. 2013 Dec 6;288(49):35617-25.
doi: 10.1074/jbc.M113.521179. Epub 2013 Oct 28.

Crystal structure of Clostridium botulinum whole hemagglutinin reveals a huge triskelion-shaped molecular complex

Affiliations

Crystal structure of Clostridium botulinum whole hemagglutinin reveals a huge triskelion-shaped molecular complex

Sho Amatsu et al. J Biol Chem. .

Abstract

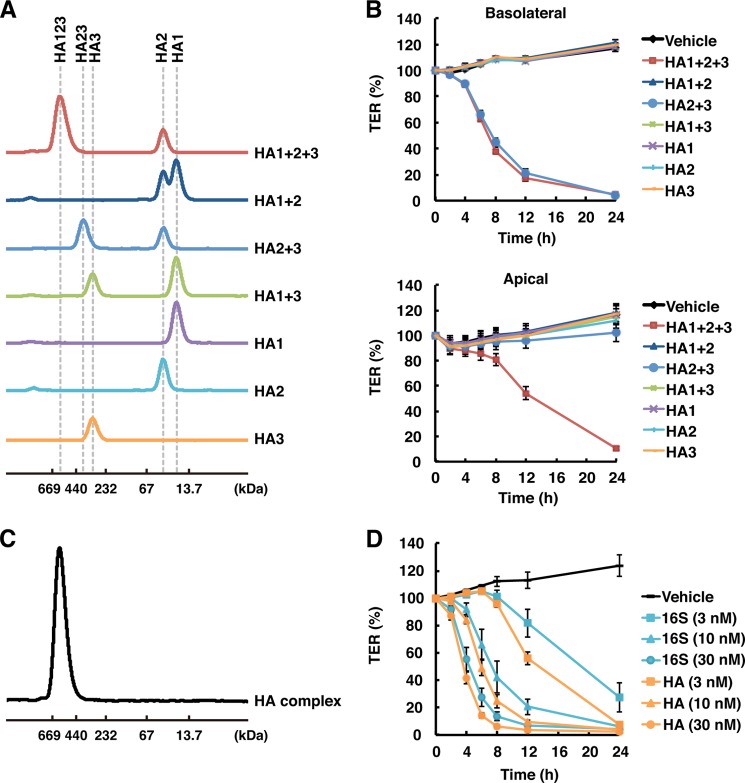
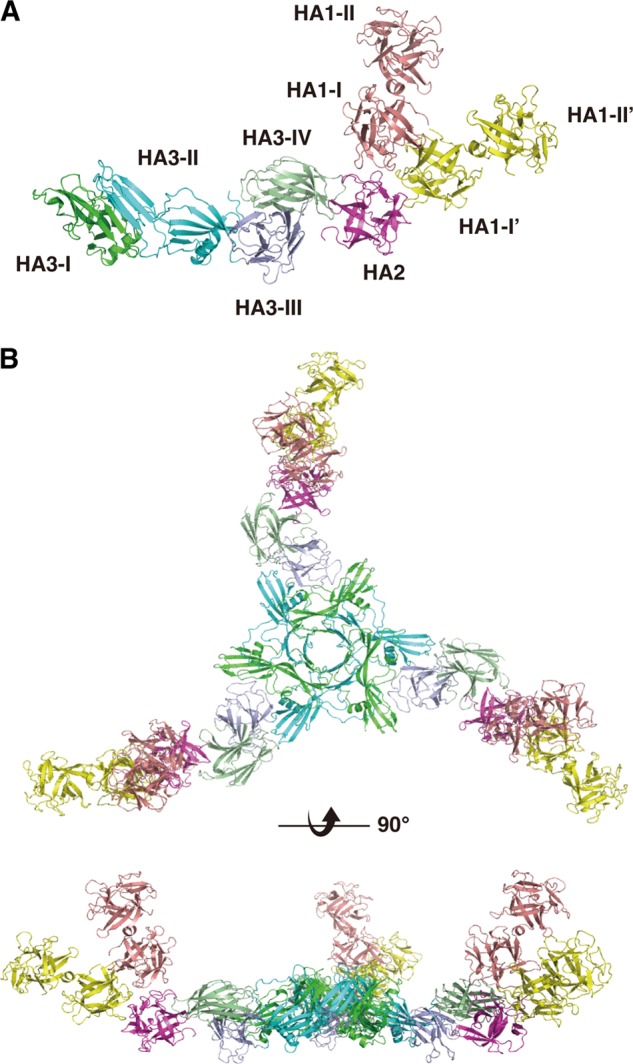
Clostridium botulinum HA is a component of the large botulinum neurotoxin complex and is critical for its oral toxicity. HA plays multiple roles in toxin penetration in the gastrointestinal tract, including protection from the digestive environment, binding to the intestinal mucosal surface, and disruption of the epithelial barrier. At least two properties of HA contribute to these roles: the sugar-binding activity and the barrier-disrupting activity that depends on E-cadherin binding of HA. HA consists of three different proteins, HA1, HA2, and HA3, whose structures have been partially solved and are made up mainly of β-strands. Here, we demonstrate structural and functional reconstitution of whole HA and present the complete structure of HA of serotype B determined by x-ray crystallography at 3.5 Å resolution. This structure reveals whole HA to be a huge triskelion-shaped molecule. Our results suggest that whole HA is functionally and structurally separable into two parts: HA1, involved in recognition of cell-surface carbohydrates, and HA2-HA3, involved in paracellular barrier disruption by E-cadherin binding.

Keywords: Bacterial Pathogenesis; Bacterial Toxins; Botulinum Toxin; Carbohydrate-binding Protein; Crystal Structure; E-cadherin; Epithelial Cell; Hemagglutinin; Protein Complexes.


Figures

FIGURE 1.
FIGURE 1.
Reconstitution of whole HA from recombinant HA subcomponents. A, each HA subcomponent, alone or in combination, was subjected to gel-filtration analysis as described under “Experimental Procedures.” Dashed lines on the chromatogram show the elution volume of the complexes or HA subcomponents, which are labeled at the top of the panel. Molecular masses were estimated from the elution volumes of the size marker proteins. B, Caco-2 cells were grown in Transwell chambers, and TER was measured in the presence of each HA subcomponent (HA1, 60 nm; HA2, 120 nm; and HA3, 30 nm), alone or in combination. The samples were applied from the basolateral (upper panel) or apical (lower panel) side of the chamber following a 3-h incubation at 37 °C. Values are means ± S.E. (n = 3). C, gel-filtration chromatogram of the whole HA complex used for crystallization. D, Caco-2 cells were treated with the indicated concentrations of B16S toxin (cyan) or HA complex (orange) from the basolateral side of the chamber, and TER was measured. Values are means ± S.E. (n = 3).
FIGURE 2.
FIGURE 2.
Structure of whole HA. A, ribbon diagram of the HA1-HA2-HA3 monomer. Pink, HA1-I and HA1-II; yellow, HA1-I′ and HA1-II′; magenta, HA2; dark green, HA3-I; cyan, HA3-II; purple, HA3-III; light green, HA3-IV. B, whole HA/B has a triskelion shape. Upper, view from the top of the trimer and parallel to the 3-fold axis. Lower, view perpendicular to the 3-fold axis.
FIGURE 3.
FIGURE 3.
Views of the interface regions between HA1 and HA2. Residues directly involved in contacts between subcomponents are shown as stick models. The calculations of interfaces between subcomponents were performed using PISA. A, the interface between HA1 and HA2 of type B. HA1 and HA2 are shown in yellow and magenta, respectively. Residues directly involved in contacts are colored blue and green for HA1 and HA2, respectively. B, the interface between HA1 and HA2 of type D (37). HA1 and HA-2 are shown in blue and cyan, respectively. Residues directly involved in contacts are colored yellow and green for HA1 and HA2, respectively. The residues involved in the interface are conserved between type B and D HA1-HA2.
FIGURE 4.
FIGURE 4.
Comparison of the structure of HA1. A, structural comparison of type B HA1-HA2 (blue) with type D HA1-HA2 (magenta). The structures were superimposed using the SSM program in Coot. HA2, HA1-I, and HA1-I′ overlapped well with each other. The structural differences occur mainly on HA-II and HA1-II′, which are sugar-binding sites. B, structural comparison of type B HA1 (pink) with type A HA1 (cyan).
FIGURE 5.
FIGURE 5.
Interactions between HA2 and HA3 in whole HA/B. A and B, close-up view of the HA2-HA3 binding regions. Residues important for interactions between HA2 and HA3 are shown in stick representation. The oxygen, nitrogen, and sulfur atoms are colored red, blue, and yellow, respectively. Carbon atoms are colored magenta in HA2 and green in HA3. C, structural comparison of type B HA3-IV domains in the HA3 trimer (orange) and in the whole HA/B complex (green). The HA2 molecule is also shown in magenta.
FIGURE 6.
FIGURE 6.
Comparisons of the structures of type B HA1-HA2-HA3 against N-CPE and C-CPE. The structures were superimposed using the SSM program in Coot. HA/B is colored as described for Fig. 2A. HA3-I, HA3-II, HA3-III, and HA3-IV are shown in dark green, cyan, purple, and light green, respectively. A, two N-CPE molecules are overlapped on the HA3-I and HA3-II domains. The two N-CPE molecules are colored wheat and light green, respectively. B, two C-CPE molecules are superimposed on the HA3-III and HA3-IV domains. The two C-CPE molecules are colored yellow and orange, respectively.
FIGURE 7.
FIGURE 7.
Model of the interaction of the B16S toxin with intestinal epithelial cells. A structural model of the B16S toxin was constructed based on the crystal structure of the type A 12 S toxin (7), HA/B (this study), and a model of the type A 12 S and B16S toxins obtained by electron microscopy (38). Left panel, on the apical side of the epithelial cells, the toxin complex binds to the cell surface via the most distally located HA1 (dotted cyan circles), which allows toxin translocation across the cell. Right panel, on the basolateral side, the complex interacts with E-cadherin through the inner region of HA (dotted red circles), thereby disrupting the epithelial barrier. Red, type A BoNT; green, type A NTNH; blue, HA.

References

    1. Poulain B., Popoff M. R., Molgo J. (2008) How do the botulinum neurotoxins block neurotransmitter release: from botulism to the molecular mechanism of action. Botulinum J. 1, 14–87
    1. Sakaguchi G. (1982) Clostridium botulinum toxins. Pharmacol. Ther. 19, 165–194 - PubMed
    1. Oguma K., Inoue K., Fujinaga Y., Yokota K., Watanabe T., Ohyama T., Takeshi K., Inoue K. (1999) Structure and function of Clostridium botulinum progenitor toxin. J. Toxicol. Toxin Rev. 18, 17–34
    1. Hill K. K., Smith T. J. (2013) Genetic diversity within Clostridium botulinum serotypes, botulinum neurotoxin gene clusters and toxin subtypes. Curr. Top. Microbiol. Immunol. 364, 1–20 - PubMed
    1. Schiavo G., Matteoli M., Montecucco C. (2000) Neurotoxins affecting neuroexocytosis. Physiol. Rev. 80, 717–766 - PubMed

Publication types

MeSH terms

Associated data