. 2014 Apr 15;522(6):1333-54.
doi: 10.1002/cne.23486.

Distinct physiological and developmental properties of hippocampal CA2 subfield revealed by using anti-Purkinje cell protein 4 (PCP4) immunostaining

Affiliations

Distinct physiological and developmental properties of hippocampal CA2 subfield revealed by using anti-Purkinje cell protein 4 (PCP4) immunostaining

Andrew San Antonio et al. J Comp Neurol. .

Abstract

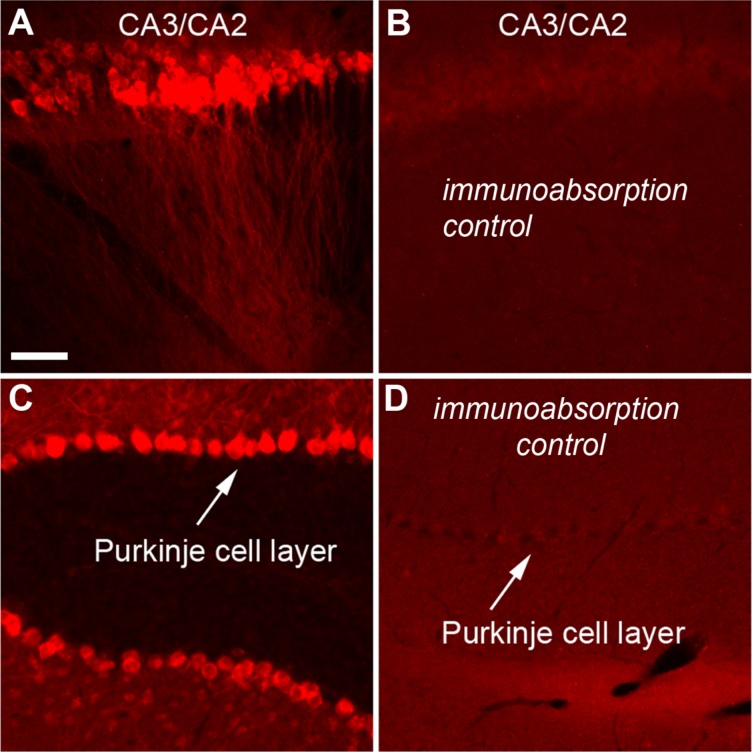
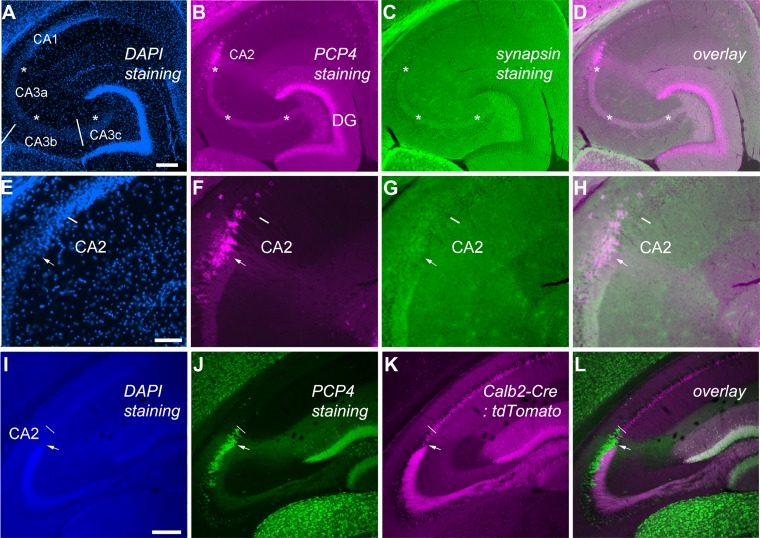
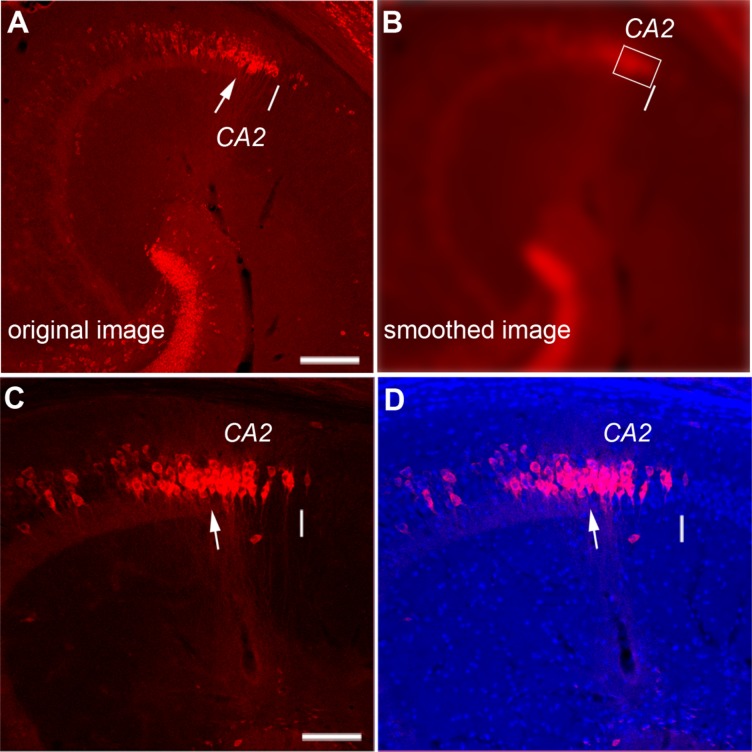
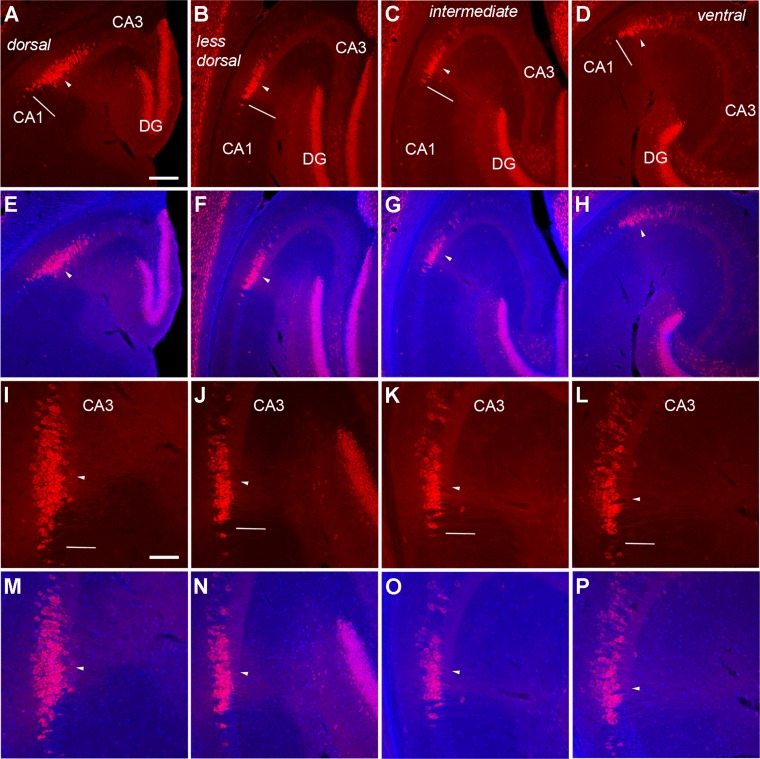
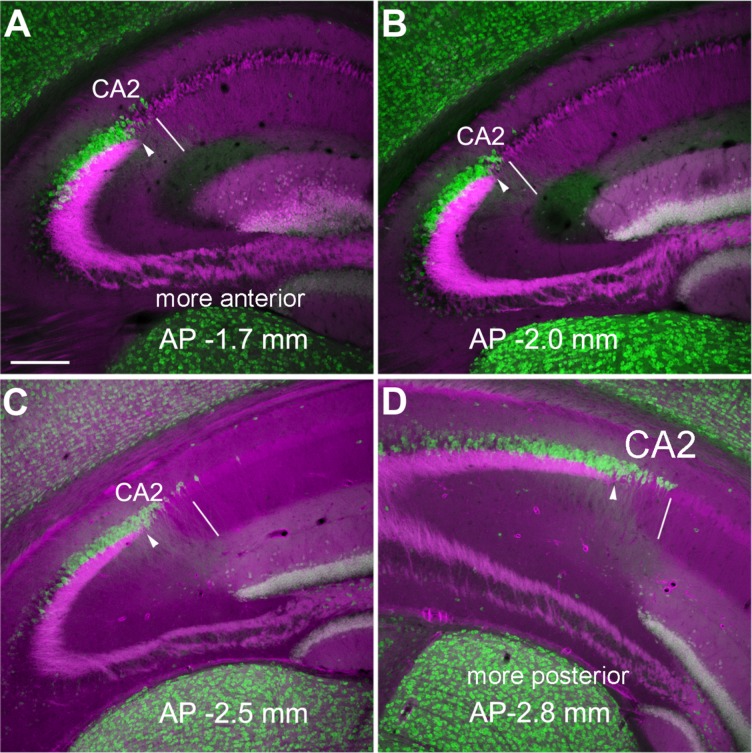
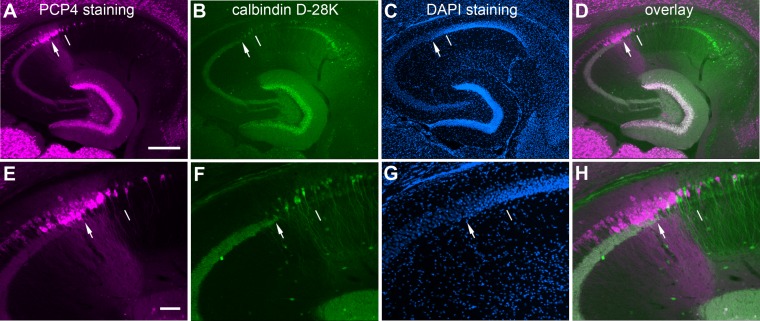
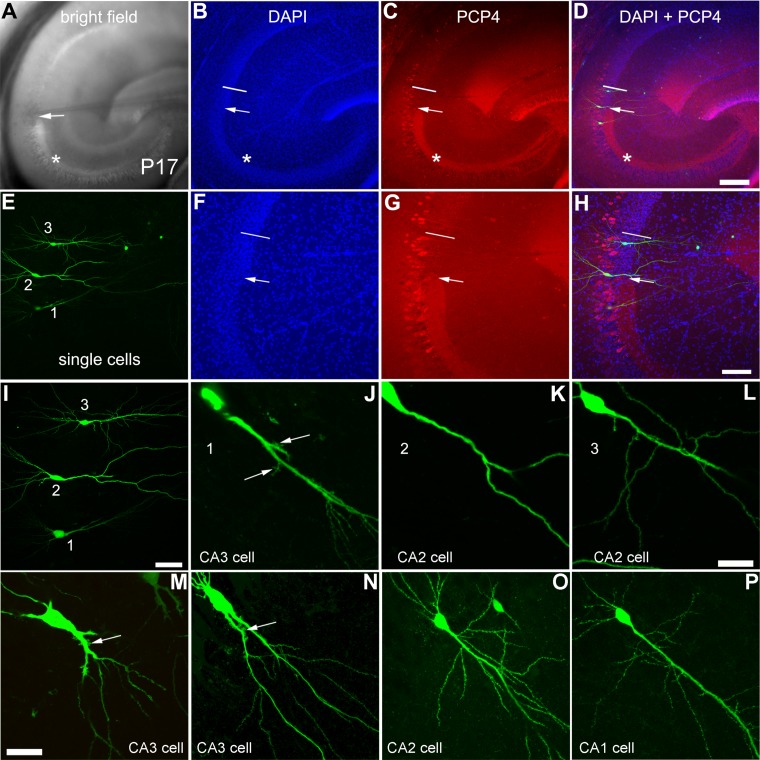
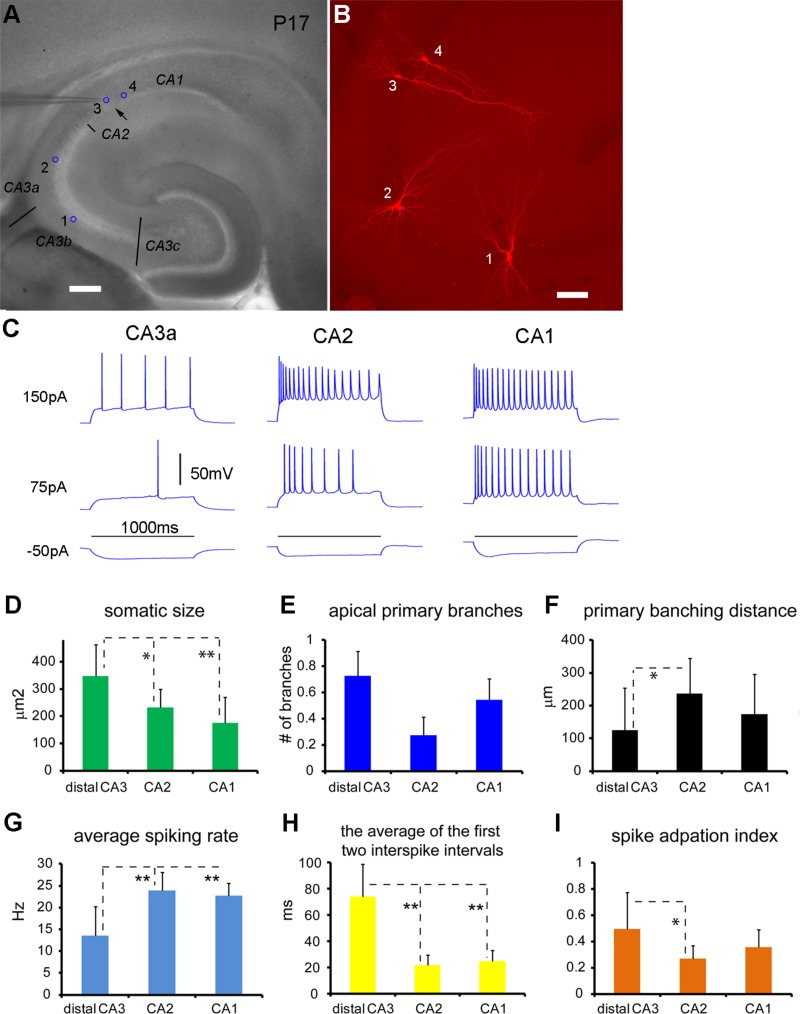
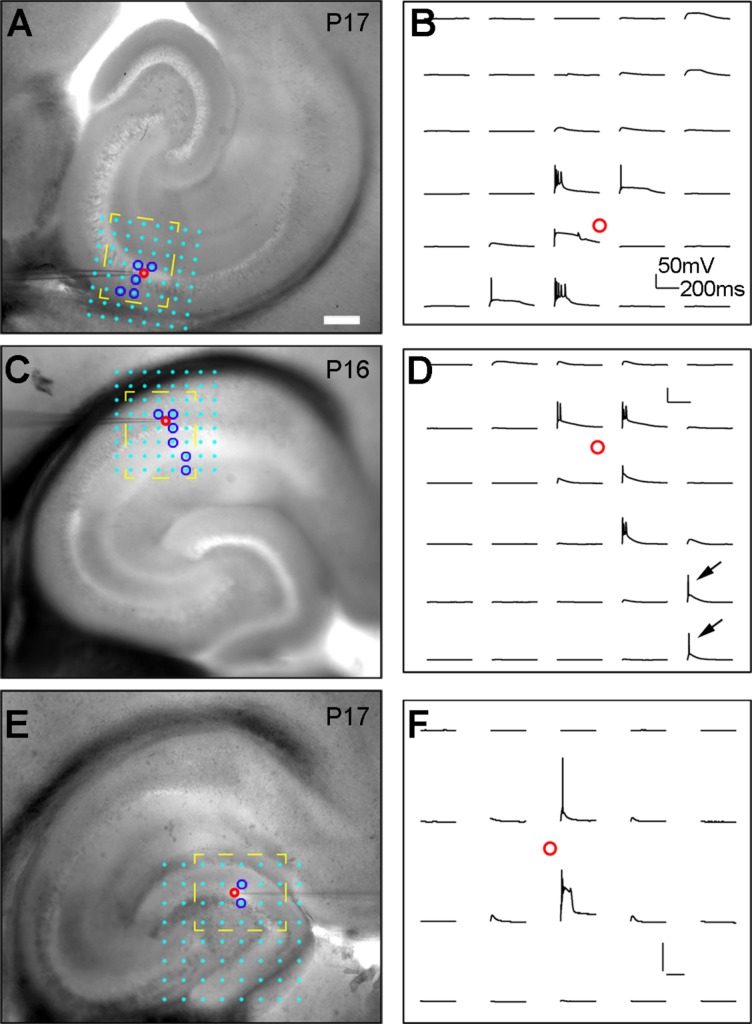
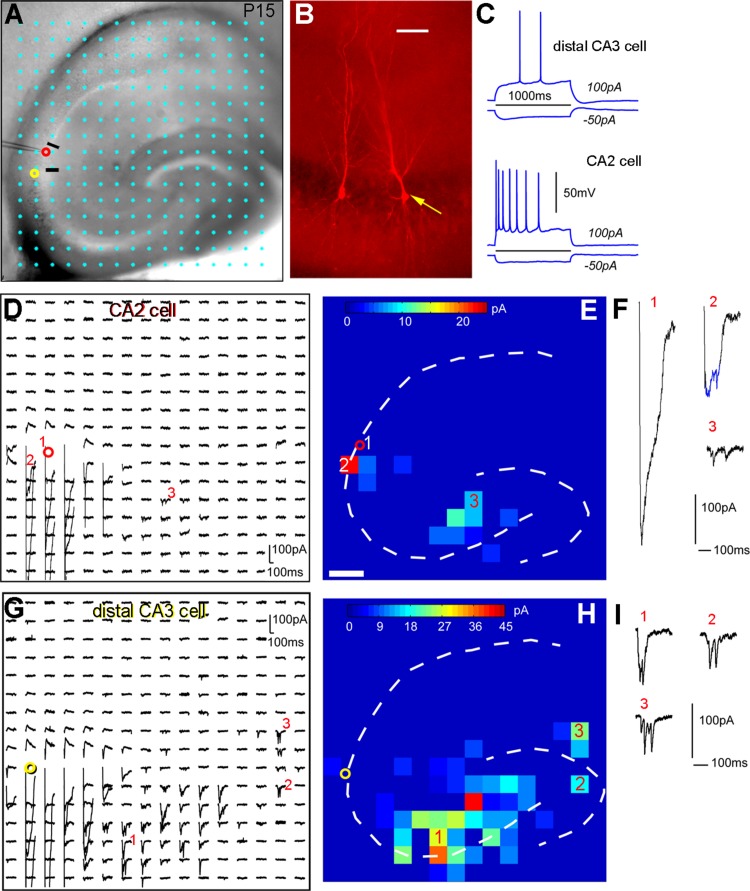
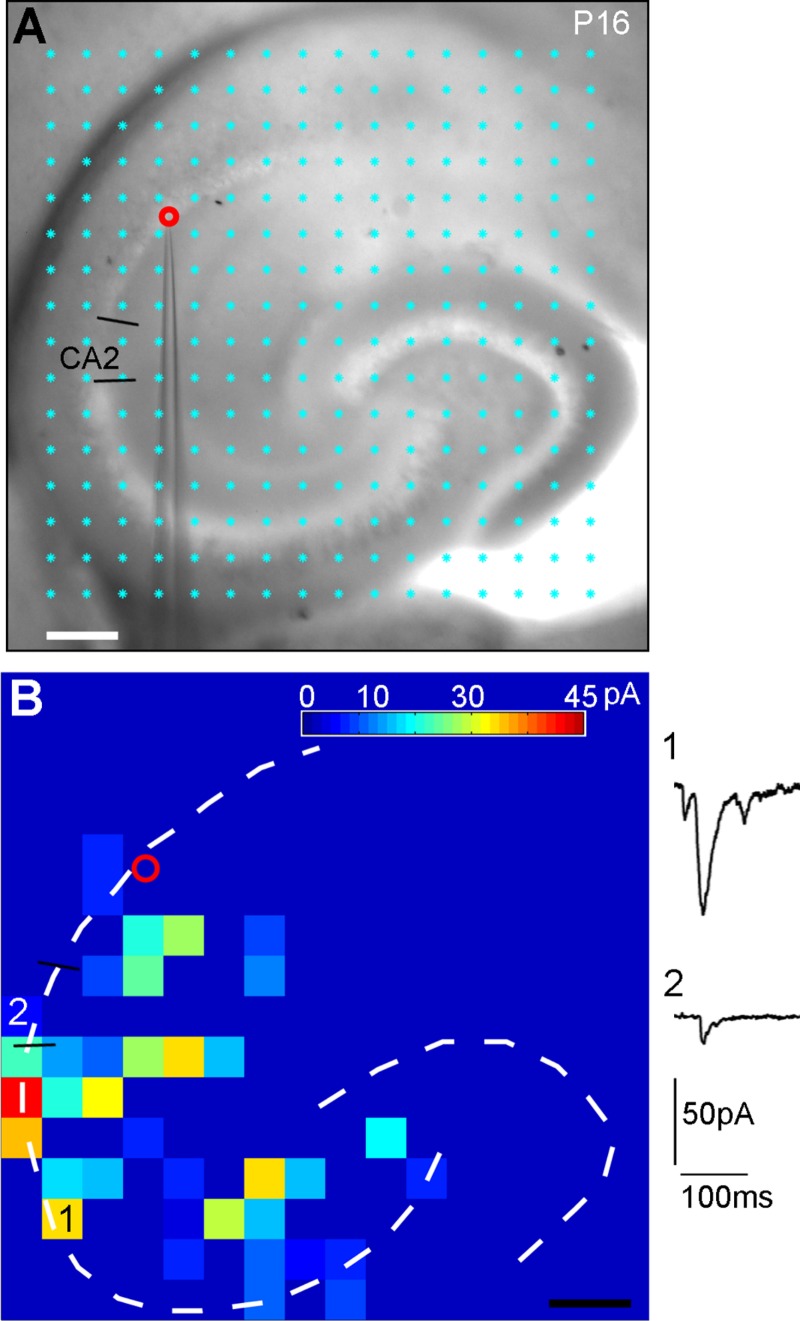
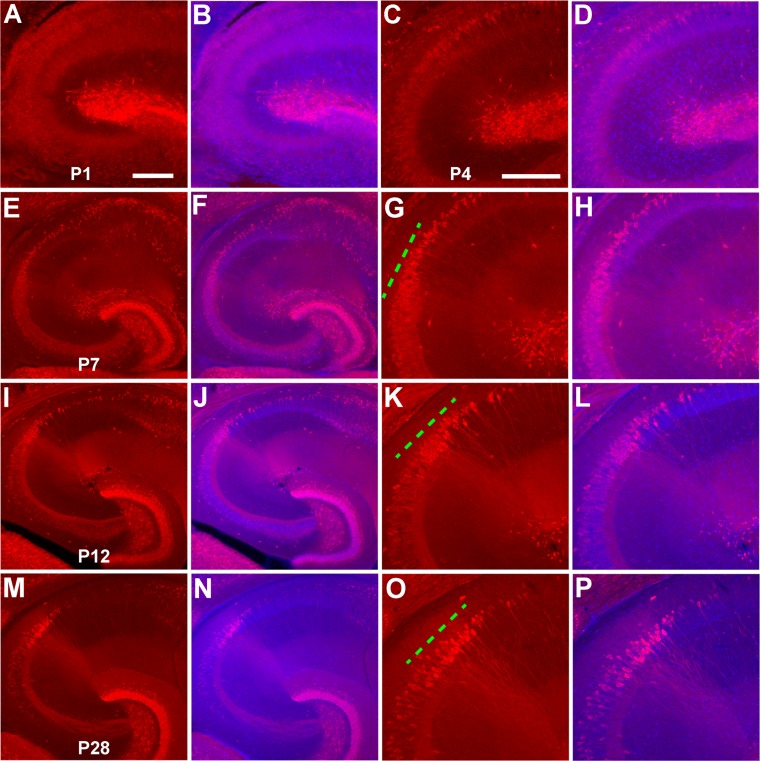
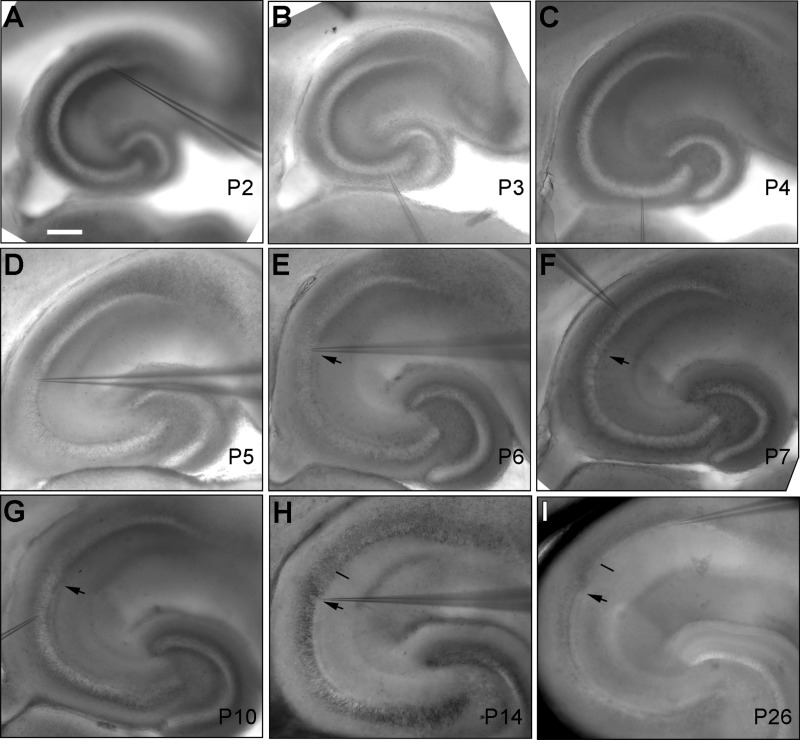
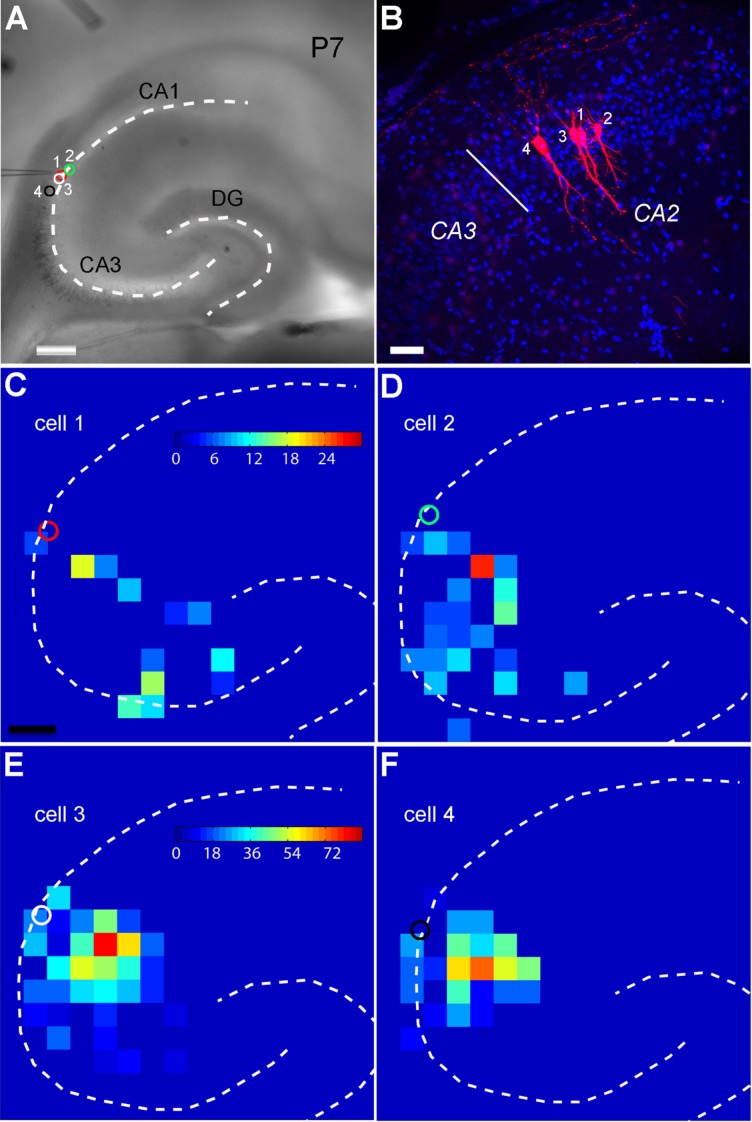
The hippocampal CA2 subfield was initially identified by Lorente de Nó as an anatomically distinct region based on its cytoarchitectural features. Although there is an enormous body of literature on other hippocampal subfields (CA1 and CA3), relatively little is known about the physiological and developmental properties of CA2. Here we report identification of the CA2 region in the mouse by immunostaining with a Purkinje cell protein 4 (PCP4) antibody, which effectively delineates CA3/CA2 and CA2/CA1 borders and agrees well with previous cytoarchitectural definitions of CA2. The PCP4 immunostaining-delineated CA2 neurons have distinguishable differences in cell morphology, physiology, and synaptic circuit connections compared with distal CA3 and proximal CA1 regions. The average somatic sizes of excitatory cells differ across CA1-3, with the smallest to largest somatic size being CA1<CA2<CA3. CA2 excitatory cells have dense dendritic spines, but do not have thorny excrescences associated with bordering CA3 neurons. Photostimulation functional circuit mapping shows that CA2 excitatory neurons receives extensive synaptic input from CA3, but no detectable input from the dentate gyrus. CA2 excitatory cells also differ significantly from CA3 cells in intrinsic electrophysiological parameters, such as membrane capacitance and spiking rates. Although CA2 neurons differ from CA1 neurons for PCP4 and other marker expressions, these neurons have less distinct neurophysiological and morphological properties. Developmental examination revealed that PCP4 immunostaining first appears at postnatal day 4-5 and becomes successively more refined around CA2 until reaching adult form by postnatal day 21.

Keywords: circuit mapping; electrophysiology; immunochemical.


Figures

Figure 1
Figure 1
Independent immunoabsorption tests confirm the specificity of the PCP4 antibody. A,B: Example staining results using the PCP4 antibody without and with preincubation with the PCP4 peptide, respectively, in mouse hippocampal horizontal sections. C,D: Example staining results using the PCP4 antibody without and with preincubation with the PCP4 peptide, respectively, in mouse cerebellar sections. Scale bar = 50 μm in A (applies to A–D).
Figure 2
Figure 2
PCP4 immunostaining effectively delineates the CA2 region in adult mouse hippocampus. A–H: Images are from the same horizontal section, with E–H depicting the CA2 region at higher magnification. The images stained for DAPI (A,E), Purkinje cell protein 4 (PCP4; B,F), and synapsin 1 (C,G) and the overlay images for PCP4 and synapsin 1 staining (D,H) are specifically shown. Asterisks (*) indicate location of the mossy fiber tract at the suprapyramidal layer (also known as the stratum lucidum), labeled by PCP4 and synapsin 1. E–H: In high-power images, the arrow indicates the end of the mossy fiber tract and the beginning of CA2, and the short bar indicates the border between CA2 and CA1 as determined by cytoarchitecture, matching PCP4 staining. I–L: Images are from the same coronal section of a Calb2-Cre:tdTomato double transgenic mouse, in which the mossy fiber tract (K) is clearly shown through red fluorescent proteins expressed by dentate granule cell axons. The same section was stained by DAPI (I) and PCP4 (J), and sequentially imaged in separate non-overlapping channels. The merge of the green and magenta channels is shown (L). Note that the basic terminology of Lorente de Nó (1934) and Ishizuka et al. (1990) is used to designate positions along the transverse axis of CA3 (CA3c, -b, --a) and CA1; the midline of the fimbria separates CA3a and CA3b. Scale bar = 200 μm in A (applies to A–D) and I (applies to I–L); 100 μm in E (applies to E–H).
Figure 3
Figure 3
Delineation of the CA2/CA1 border aided by simple image processing protocol. A,B: The original (A) and smoothed (B) images. The white arrow indicates the end of mossy fibers (i.e., the border of distal CA3 and CA2) from A, and the white line determined from B indicates the CA2/CA1 border. B is a smoothed version of the image shown in A using Gaussian blurring with an empirically determined radius of 20 μm (about the size of two PCP+ cell bodies; see Materials and Methods). This smoothing results in the exclusion of sparsely labeled PCP4-positive cells across hippocampal subregions. Furthermore, applying a 50% local intensity threshold to the smoothed image helps to identify the CA2/CA1 border (indicated by the white line in A and B). The white rectangular box encloses the CA2 region with the main cluster of PCP4-stained cells in the absence of mossy fibers. C,D: The CA2/CA1 border identified with this protocol is consistent with the cytoarchitectural border determined from the transition of DAPI nuclear staining in the pyramidal cell layer, as shown in the images of PCP4 immunostaining and PCP4/DAPI staining overlay of an example hippocampal section. Note that CA1 has more compact DAPI nuclear staining compared with CA2. In addition, the cytoarchitectural transition from distal CA3 to CA2 includes overall smaller somatic sizes of the putative excitatory pyramidal cells in CA2, compared with CA3. Scale bar = 200 μm in A (applies to A,B); 100 μm in C (applies to C,D).
Figure 4
Figure 4
PCP4 staining varies along the dorsal–ventral axis across horizontal sections of adult mouse hippocampus. The images of PCP4 immunostaining (A–D, I–L) and PCP4/DAPI staining overlays (E–H, M–P) of the example sections from dorsal (A,E,I,M), less dorsal (B,F,J,N), intermediate (C,G,K,O), and ventral levels (D,H,L,P) taken under lower (A–H) versus higher power (I–P) objectives. PCP4 staining is denser and more widespread in dorsal regions of the adult mouse hippocampus. The arrowhead indicates the end of the mossy fiber tract and beginning of CA2, and the short bar indicates the border between CA2 and CA1 as determined by cytoarchitectural structure revealed by DAPI staining. For quantification, the dorsal and less dorsal sections were pooled for the dorsal group, and the intermediate and ventral sections were pooled for the ventral group. Scale bar = 200 μm in A (applies to A–H); 100 μm in I (applies to I–P).
Figure 5
Figure 5
PCP4 staining differs along the anterior–posterior axis across coronal sections of adult mouse hippocampus. A–D: The overlaid images (PCP4, green and mossy fiber tract, magenta) of the coronal sections at different anterior–posterior (AP) coordinates show more widespread PCP4 immunolabeling at the posterior sections. The PCP4 staining was done on the sections of Calb2-Cre:tdTomato mice, in which dentate granule cells express red fluorescent proteins in their mossy fibers. The arrowhead indicates the end of the mossy fiber tract, and the thin white line indicates the border between CA2 and CA1. Scale bar = 200 μm in A (applies to A–D).
Figure 6
Figure 6
Double immunolabeling of mouse hippocampal sections against PCP4 and calbindin D-28K (CB) further helps to determine the distal CA3/CA2 border. A–H: The images of PCP4 immunostaining (A,E), CB staining (B,F), DAPI staining (C,G), and PCP4/CB staining overlays (D,H) of one example hippocampal section, taken under lower (A–D) versus higher power (E–H) objectives. The arrowhead indicates the end of the mossy fiber tract, and the thin white line indicates the border between CA2 and CA1. Scale bar = 200 μm in A (applies to A–D); 50 μm in E (applies to E–H).
Figure 7
Figure 7
Excitatory pyramidal cells in the CA2 region have distinct morphology from CA3 excitatory cells. A–D: The brightfield image of a living hippocampal slice (A), the aligned images of the same slice fixed and stained by DAPI and PCP4 (B,C), and their overlay image (D). E–H: Intracellularly recorded excitatory cells revealed by biocytin staining, which are located at distal CA3 (1), the beginning of CA2 (2), and the end of CA2 (3) in the same slice shown in A. Their locations are verified through DAPI and PCP4 immunostaining (F,G,H). The arrow depicts the end of the mossy fiber tract and the beginning of CA2; the short bar represents the border between CA2 and CA1. I–L: Detailed morphology of the recorded cells. The distal CA3 excitatory cell (J) has thorny excrescences (indicated by the arrows) at its proximal apical dendrites; CA2 cells (K,L) show no sign of such complex postsynaptic spines. M–P: More example cells in CA3 and CA2, as well as in CA1. Excitatory pyramidal cells from midfield (CA3b) and distal CA3 (CA3a) are shown with thorny excrescences (indicated by the arrow) in M and N, respectively. The CA2 pyramidal cells (K,L,O) are similar to the CA1 pyramidal cell (P), lacking thorny excrescences at their proximal apical dendrites. Scale bar = 200 μm in D (applies to A–D); 100 μm in H (applies to E–H); 50 μm in I; 20 μm in L (applies to J–L); and 40 μm in M (applies to M–P).
Figure 8
Figure 8
Excitatory pyramidal cells in CA2 and CA1 differ from distal CA3 excitatory cells in their morphological and intrinsic electrophysiological properties. A,B: The locations and morphology of the recorded cells visualized by intracellular biocytin staining. The cells of 1–4 (indicted by the blue circles in A) are located in CA3b, CA3a, CA2, and CA1, respectively. Note the morphological transition of the pyramidal cell shapes from CA3 to CA2 and CA1. Whereas cell 1 has two major apical dendrites, cells 2 and 4 have two primary branches originating from their single apical dendrites. Cell 3 has no apparent primary branch off its apical dendrite. The primary branching distances of cells 1 and 2 are shorter than that of cell 4. C: Intrasomatic current injection responses of the cells of 2–4 shown in A and B. Generally, CA2 excitatory cells, like CA1 cells, have higher spiking rates than CA3 excitatory cells. D–F: Group summary data of morphological quantification for CA3a, CA2, and CA1 cells (n = 11, 12, and 12, respectively). The values are presented as mean ± SD. G–I: Group summary data of electrophysiological quantification for CA3a, CA2, and CA1 cells (n = 20, 14, and 14, respectively). * and ** indicate the statistical significance of P < 0.05 and P < 0.005 for comparison between CA3a and CA2 or CA1, respectively. Scale bar = 200 μm in A; 100 μm in B.
Figure 9
Figure 9
Validation of spatial resolution of laser scanning photostimulation (LSPS) by examining the excitability profiles of excitatory neurons in CA3, CA1, and the fascia dentate of the dentate gyrus (DG). A,B: The excitability profile (i.e., spatial distribution of uncaging sites that produce action potentials) of a CA3a cell recorded in current clamp mode. The 8 × 8 photostimulation sites (spaced at 80 μm2) are shown with cyan dots overlying the slice image; photostimulation-evoked action potentials (spikes) are restricted to a small region (blue circles, shown in A), and the response traces within the yellow, dashed region are separately shown in B. C–F: The excitability profiles of a CA1 cell (C,D) and a DG granule cell (E,F), as similarly formatted in A and B. The arrows in D indicate the evoked spikes in response to photostimulation at the cell’s distal apical dendrites (as seen for some CA3 cells as well) in the S-LM layer, which decreases the LSPS resolution along the vertical dendritic dimension. However, as we are concerned about excitatory input from different hippocampal subfields (CA3-1) and the fascia dentate, the most relevant spatial resolution in the hippocampus proper is defined as the lateral distance in the main axonal projection axis of DG→CA3→CA1, relative to the photostimulation site. By this definition, the average spatial precision of the method is within 108 ± 42 μm (mean ± SD, n =17 cells) of photostimulation sites. Also see Materials and Methods for exclusion of photostimulation-evoked EPSCs in the S-LM layer. Considering that the total distance from DG to CA2/CA1 is more than 1,200 μm, this approach allows valid measures of differences of inputs to the recorded cell types from specific hippocampal subfields and the fascia dentate. In addition, the excitability profile experiments did not show evidence of synaptically driven spiking by photostimulation (i.e., no spike-evoking sites far away from the perisomatic area of the recorded neuron), indicating that the LSPS maps represent monosynaptic inputs. Scale bar = 200 μm in A (applies to A,C,E).
Figure 10
Figure 10
Laser scanning photostimulation reveals that CA2 excitatory pyramidal neurons receive excitatory synaptic input from CA3 cells but not from dentate granule cells. A: The mouse hippocampal slice image with the superimposed photostimulation sites (16 × 16 cyan dots, spaced at 100 μm × 100 μm). The cell body locations of the sequentially recorded CA2 and distal CA3 cells are indicated by the red and yellow circles, respectively. The short black lines indicate the borders of CA2. B: The pyramidal cell morphology of the recorded cells. The yellow arrow points to the distal CA3 cell bordering CA2. C: Intrasomatic current injection responses of the two recorded cells. D: An array of photostimulation-evoked response traces from the corresponding sites in A, with the recorded CA2 cell held in voltage clamp mode to detect inward excitatory postsynaptic currents (EPSCs). The red circle indicates the recorded cell body location of the CA2 cell. Only the 250 ms of the recorded traces after the onset of laser photostimulation are shown. F: Different forms of photostimulation responses are illustrated by the traces, which are expanded and shown separately. Trace 1 is an example of a large direct response (excluded for further analysis) to glutamate uncaging on the cell body. Trace 2 shows an example of relatively small direct response, with over-riding synaptic responses (blue). Trace 3 is a typical example of synaptic input responses. E: The color-coded, averaged input map constructed from D (with each square corresponding to one stimulation site) superimposed with the hippocampal contour, illustrating the pattern and strength of synaptic input to the recorded neuron. The input amplitude from each stimulation site is a measurement of average integrated strength of individual EPSCs in the specified analysis window, with the baseline spontaneous response subtracted from the photostimulation response of the same site. The numbered sites correspond to the illustrated response traces. G–I: Photostimulation-based circuit mapping for the distal CA3 cell, as formatted in D–F. Scale bar = 50 μm in B; 200 μm in E (applies to E,H).
Figure 11
Figure 11
CA1 excitatory pyramidal cells receive strong and extensive excitatory synaptic input from CA3. A: The mouse hippocampal slice image with the superimposed photostimulation sites (16 × 16 cyan dots, spaced at 100 μm × 100 μm). The somatic location of the recorded CA1 pyramidal cell is indicated by the red circle. B: The color-coded, averaged input map illustrating that CA1 excitatory cells receive extensive synaptic input from CA3, as well as weaker input from CA1 and CA2. The numbered sites correspond to the illustrated response traces. Scale bar = 200 μm in A,B.
Figure 12
Figure 12
PCP4 immunostaining in the CA2 region emerges and develops postnatally. A–P: Images of PCP4 immunostaining (A,C,E,G,I,K,M,O) and PCP4/DAPI staining overlays (B,D,F,H,J,L,N,P) for P1, P4, P7, P12, and P28 mouse hippocampal sections, respectively. The images of PCP4 immunostaining and DAPI/PCP4 staining overlays are at different magnification, acquired under lower (E,F, I,J, M,N) versus higher power (A–D, G,H, K,L, O,P) objectives. The green dashed line indicates the dense PCP4 staining at the intermediate region between CA3 and CA1. Scale bar = 200 μm in A (also applies to B,E,F,I,J, M,N) and C (also applies to D,G,H,K,L,O,P).
Figure 13
Figure 13
Examination of living slice morphology at different developmental times supports the postnatal emergence of a distinct CA2 region. A–I: Brightfield images of P2, P3, P4, P5, P6, P7, P10, P14, and P26 living mouse hippocampal sections, respectively. The arrowhead in E–I points to the end of the mossy fiber tract in distal CA3; the thin black bar indicates the CA2/CA1 border, which is identifiable at and beyond P14. Scale bar = 200 μm in A (applies to A–I).
Figure 14
Figure 14
Intrahippocampal excitatory circuit connections to CA2 excitatory pyramidal cells at P7. A: Mouse hippocampal slice image with the dashed lines showing the hippocampal contour. The somatic locations of four sequentially recorded CA2 pyramidal cells are indicated by the red, green, white, and black circles, respectively. B: The pyramidal cell morphology of the four recorded cells revealed by intracellular biocytin staining, against the DAPI (blue) staining. C–F: The color-coded, averaged input maps showing that these CA2 excitatory cells receive synaptic input from CA3 with different patterns and strengths. Scale bar = 200 μm in A and C (applies to C–F); 50 μm in B.

References

    1. Bischofberger J, Engel D, Li L, Geiger JR, Jonas P. Patch-clamp recording from mossy fiber terminals in hippocampal slices. Nat Protoc. 2006;1:2075–2081. - PubMed
    1. Bland ST, Tamlyn JP, Barrientos RM, Greenwood BN, Watkins LR, Campeau S, Day HE, Maier SF. Expression of fibroblast growth factor-2 and brain-derived neurotrophic factor mRNA in the medial prefrontal cortex and hippocampus after uncontrollable or controllable stress. Neuroscience. 2007;144:1219–1228. - PMC - PubMed
    1. Brivanlou IH, Dantzker JL, Stevens CF, Callaway EM. Topographic specificity of functional connections from hippocampal CA3 to CA1. Proc Natl Acad Sci U S A. 2004;101:2560–2565. - PMC - PubMed
    1. Burkhalter A. Many specialists for suppressing cortical excitation. Front Neurosci. 2008;2:155–167. - PMC - PubMed
    1. Caruana DA, Alexander GM, Dudek SM. New insights into the regulation of synaptic plasticity from an unexpected place: hippocampal area CA2. Learn Mem. 2012;19:391–400. - PMC - PubMed

Publication types

MeSH terms