. 2013 Nov 19;110(47):18904-9.
doi: 10.1073/pnas.1310240110. Epub 2013 Oct 28.

Detection and mapping of 5-methylcytosine and 5-hydroxymethylcytosine with nanopore MspA

Affiliations

Detection and mapping of 5-methylcytosine and 5-hydroxymethylcytosine with nanopore MspA

Andrew H Laszlo et al. Proc Natl Acad Sci U S A. .

Abstract

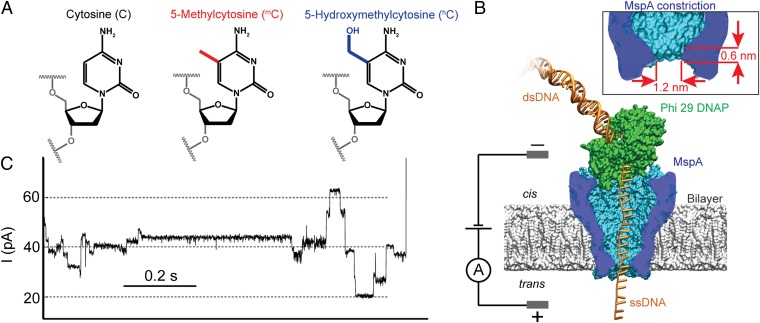
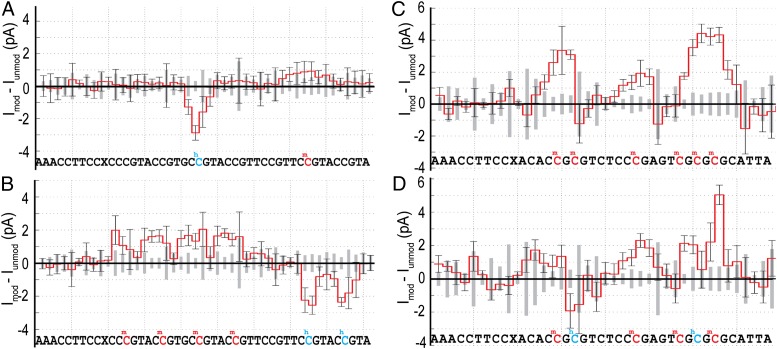
Precise and efficient mapping of epigenetic markers on DNA may become an important clinical tool for prediction and identification of ailments. Methylated CpG sites are involved in gene expression and are biomarkers for diseases such as cancer. Here, we use the engineered biological protein pore Mycobacterium smegmatis porin A (MspA) to detect and map 5-methylcytosine and 5-hydroxymethylcytosine within single strands of DNA. In this unique single-molecule tool, a phi29 DNA polymerase draws ssDNA through the pore in single-nucleotide steps, and the ion current through the pore is recorded. Comparing current levels generated with DNA containing methylated CpG sites to current levels obtained with unmethylated copies of the DNA reveals the precise location of methylated CpG sites. Hydroxymethylation is distinct from methylation and can also be mapped. With a single read, the detection efficiency in a quasirandom DNA strand is 97.5 ± 0.7% for methylation and 97 ± 0.9% for hydroxymethylation.

Keywords: DNA hydroxymethylation; DNA methylation; nanopore DNA sequencing; nanotechnology; next generation sequencing.


Conflict of interest statement

Conflict of interest statement: A.H.L., I.M.D., and J.H.G have filed a provisional patent on the detection strategy described herein. I.M.D. and J.H.G. have an interest with Illumina Inc. through licensed technology.

Figures

Fig. 1.
Fig. 1.
Methylated cytosines and schematic setup. (A) Chemical structure of cytosine (C), 5-methylcytosine (mC), and 5-hydroxymethylcytosine (hC). (B) Schematic of a typical MspA–phi29 DNA polymerase (DNAP) experiment. MspA (in blue) is a membrane protein embedded in a phospholipid bilayer. A voltage across the membrane causes an ion current to flow through the pore. We use phi29 DNAP (in green) to feed DNA through the pore in controlled, single-nucleotide steps (see SI Appendix, Fig. S1 for DNA configuration used in phi29 DNAP experiments). (Inset) The short and narrow constriction of MspA concentrates the ion current to resolve the relatively small differences between C, mC, and hC. (C) A typical current trace of DNA being pulled through MspA by phi29 DNAP in synthesis mode (Materials and Methods). As the DNA moves through the pore in single-nucleotide steps, one observes clearly discernible current levels that are associated with DNA sequence. The level duration is stochastic.
Fig. 2.
Fig. 2.
Methylation detection. (A and B) Segments of raw current traces. Ion current changes as DNA passes through the pore in single-nucleotide steps. Average current values for each current level are shown in black or red. The traces shown in A and B are for DNA with identical nucleotide sequence. The current trace shown in A contains a single unmethylated CpG site, whereas the trace in B contains a single mCpG. (C) Extracted average current values from each level in A in black and B in red. The stochastic duration of current levels has been removed so that the DNA base sequence can be aligned to the observed current levels. The DNA sequence is shown below with the modified C indicated in red. (D) Current difference plot. The current levels obtained with methylated DNA were subtracted from the current levels obtained with unmethylated DNA. The effect of a single mCpG causes an ion current increase that persists over approximately four steps of the DNA through the pore. The magnitude and shape of the current difference is determined by the nucleotides adjacent to the methylated C (Figs. 3 and 4).
Fig. 3.
Fig. 3.
Differences in the ion current level sequences taken with DNA containing methylation (hydroxymethylation) and DNA without methylation. (A and B) Current differences [∆I = ImethIunmeth; in red, where Imeth (Iunmeth) is the average current for at least 20 reads of methylated (unmethylated) DNA] obtained with two DNA strands each containing three methylated CpG sites, indicated by red letters in the associated sequence. X is an abasic site. The methylated positions are marked by a significant current increase that persists over approximately four steps of the DNA through the pore. The amplitude and shape of the current difference depend on the nucleotides adjacent to the mC. In regions containing no methylation, current differences are insignificant. (C and D) Current difference obtained with two DNA strands each containing three hCpG sites [∆I = IhydroxyIunmeth; in blue, where Imeth (Iunmeth) is the average current for at least 23 reads of hydroxymethylated (unmethylated) DNA]. In most cases, hC results in a small reduction in current, although the magnitude of the current difference is less than observed for mC. In a few cases, hC results in a current increase. Error bars are the observed SD for single-molecule reads of methylated DNA and indicate the variation in single-molecule reads. The gray boxes along the x axis are the SDs for reads of unmethylated DNA. See SI Appendix, Table S1, for exact numbers of events.
Fig. 4.
Fig. 4.
DNA sequence context changes the current difference pattern when a modified cytosine replaces a cytosine at a CpG site. Shown are the current difference patterns caused by the sequence XYmCpG in A or XYhCpG in B, where X and Y are any of the four nucleotides A, C, G, and T. The rightmost column and bottom row of each figure display the current differences averaged over the nucleotides X or Y, respectively, and the bottom right box displays the average current difference for all studied sequence contexts. Both the amplitude and the shape of current difference change with sequence context. (A) The maximum difference reaches 7 pA for AAmCpG and is only 1–2 pA when XY contains a thymine. The average maximum difference is ∼2 pA. The number of levels showing a significant current difference varies from 3 to 5. The difference is maximal when the mC is immediately above the constriction and the distribution is skewed. (B) Current deviations due to hC are more complex. Generally, when the hC is centered within MspA’s constriction, the difference is −2 to −1 pA. However, some contexts involve positive differences. The differences associated with sequences containing XThCpG, XAhCpG, AYhCpG, and CYhCpG are small, with only ∼1σ differences. As seen for mC, difference patterns caused by hC involve between 3 and 5 levels and are also skewed. The average difference patterns due to mC and hC are similar; both difference patterns map out a single tight recognition site within MspA’s constriction (Fig. 5).
Fig. 5.
Fig. 5.
Spatial methylation sensitivity of MspA. Schematic cross-section of MspA with mC held just above (A) and just below (B) MspA’s constriction. Orange shading indicates the region of higher electric field within MspA. (A) When mC is cis of the constriction, it is in a high field region and it modulates the ion current. Other nucleotides that are also within the high field region determine the magnitude of the mC-specific signal. (B) When mC is trans of the constriction, it is outside the high field region and no longer affects the current.
Fig. 6.
Fig. 6.
Multiple adjacent mCs and hCs. Current differences (ImodifiedIunmodified) for four DNA strands containing different methylation patterns. Although CpGs rarely occur in such high density, it is possible to discern multiple adjacent mCpGs and hCpGs. (A) Data from a strand containing one mC (indicated in red) and one hC (indicated in blue) demonstrates that one can simultaneously detect mC and hC. (B) A strand with identical sequence to that shown in A but containing four mCs (red) as well as two hCs (blue). Individual mCs and hCs can be resolved. (C) Adjacent mCpG sites result in wide and large current difference profiles. The current difference profiles for individual mCs seemingly superimpose. The current increase in the middle of the trace is due to only one mCpG and compares well with a mCpG embedded in the same sequence context shown in Fig. 4B above. (D) Current differences for a strand with identical sequence to that in C but with two mCs (red) replaced by two hCs (blue). Here, the effects of mC and hC counteract one another. As in C, the result is approximately a superposition of the signals shown in Fig. 4 (SI Appendix, Figs. S9 and S10 show data from which these plots are derived).

Comment in

References

    1. Bird A. Perceptions of epigenetics. Nature. 2007;447(7143):396–398. - PubMed
    1. Marx V. Epigenetics: Reading the second genomic code. Nature. 2012;491(7422):143–147. - PubMed
    1. Iqbal K, Jin SG, Pfeifer GP, Szabó PE. Reprogramming of the paternal genome upon fertilization involves genome-wide oxidation of 5-methylcytosine. Proc Natl Acad Sci USA. 2011;108(9):3642–3647. - PMC - PubMed
    1. Das PM, Singal R. DNA methylation and cancer. J Clin Oncol. 2004;22(22):4632–4642. - PubMed
    1. Gal-Yam EN, Saito Y, Egger G, Jones PA. Cancer epigenetics: Modifications, screening, and therapy. Annu Rev Med. 2008;59:267–280. - PubMed

Publication types