. 2013 Nov 19;110(47):19000-5.
doi: 10.1073/pnas.1312648110. Epub 2013 Oct 28.

Pulvinar neurons reveal neurobiological evidence of past selection for rapid detection of snakes

Affiliations

Pulvinar neurons reveal neurobiological evidence of past selection for rapid detection of snakes

Quan Van Le et al. Proc Natl Acad Sci U S A. .

Abstract

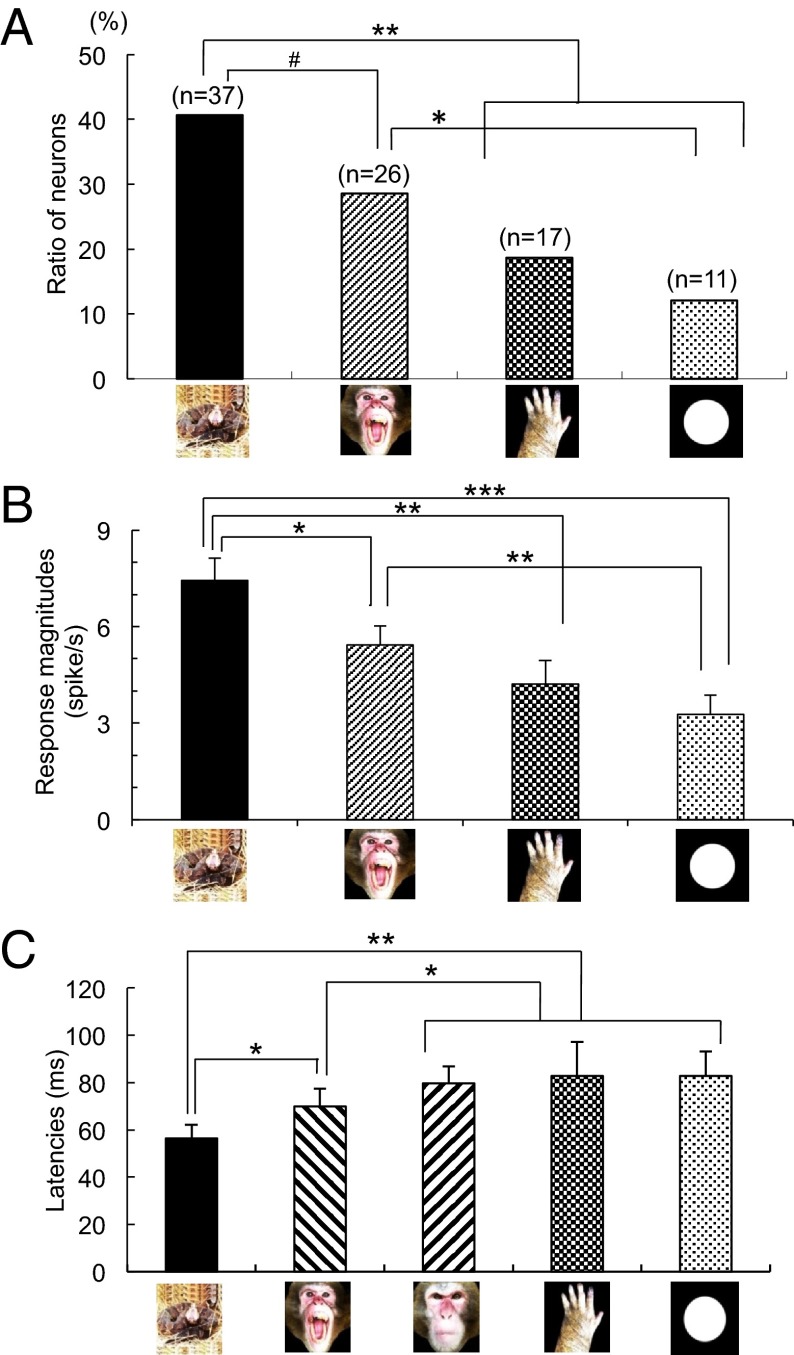
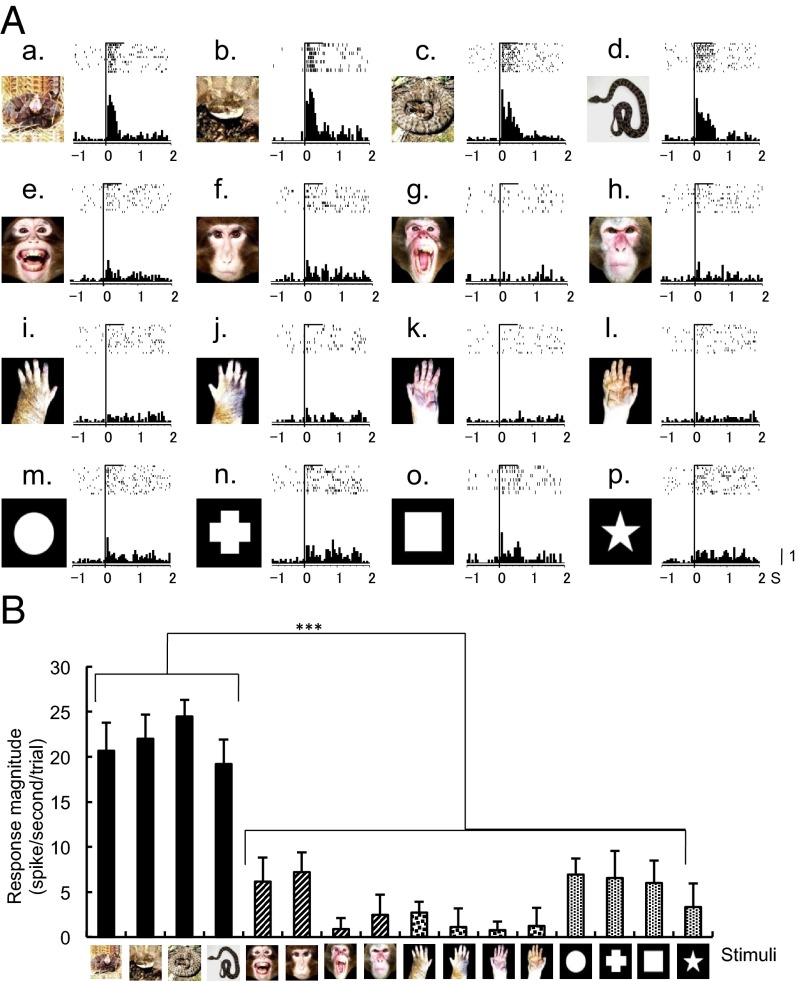
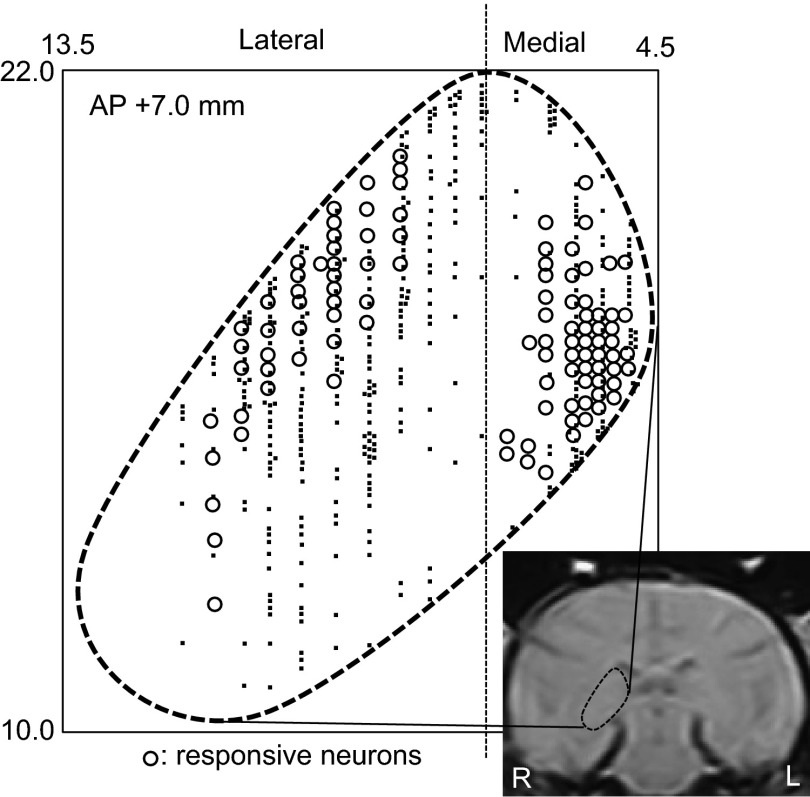
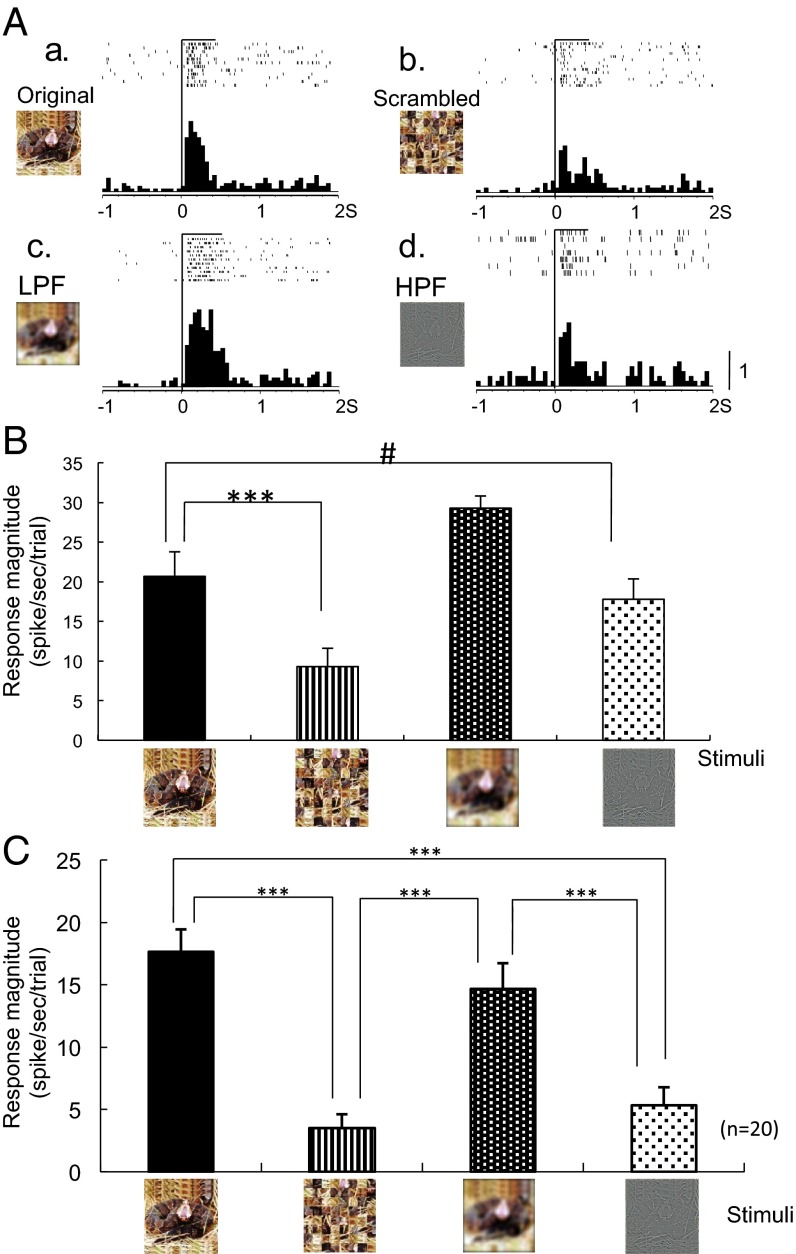
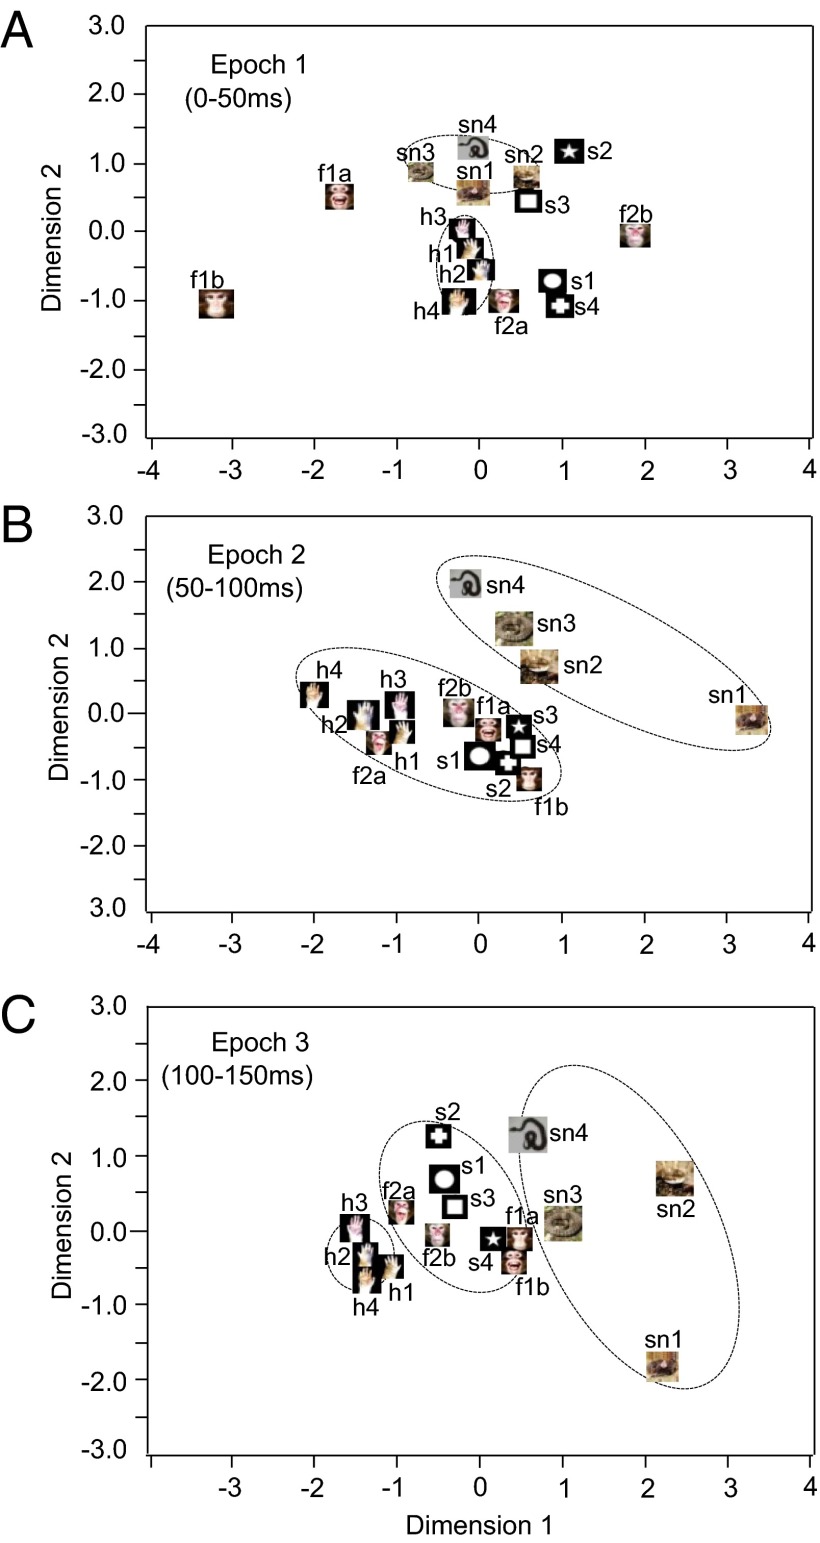
Snakes and their relationships with humans and other primates have attracted broad attention from multiple fields of study, but not, surprisingly, from neuroscience, despite the involvement of the visual system and strong behavioral and physiological evidence that humans and other primates can detect snakes faster than innocuous objects. Here, we report the existence of neurons in the primate medial and dorsolateral pulvinar that respond selectively to visual images of snakes. Compared with three other categories of stimuli (monkey faces, monkey hands, and geometrical shapes), snakes elicited the strongest, fastest responses, and the responses were not reduced by low spatial filtering. These findings integrate neuroscience with evolutionary biology, anthropology, psychology, herpetology, and primatology by identifying a neurobiological basis for primates' heightened visual sensitivity to snakes, and adding a crucial component to the growing evolutionary perspective that snakes have long shaped our primate lineage.

Keywords: Snake Detection Theory; evolution; low-pass filtered images; visual responses.


Conflict of interest statement

The authors declare no conflict of interest.

Figures

Fig. 1.
Fig. 1.
Neurophysiological characteristics of pulvinar neurons. (A) Ratio of the neurons that responded best to each stimulus category. **P < 0.01, *P < 0.05, #P < 0.10, significant difference (χ2 test). (B) Mean response magnitude to each stimulus category. ***P < 0.001, **P < 0.01, *P < 0.05, significant difference (Bonferroni test after one-way ANOVA). (C) Mean response latency to each stimulus category. **P < 0.01, *P < 0.05, significant difference (Bonferroni test after one-way ANOVA).
Fig. 2.
Fig. 2.
An example of a pulvinar neuron that responded most strongly to snakes. (A, a–p). Raster displays of neuronal activities and their summed histograms in response to each stimulus. (a–d) responses to snakes, (e–h) responses to monkey faces, (i–l) responses to monkey hands, and (m–p) responses to simple geometrical shapes. Horizontal bars above the raster displays indicate the stimulus presentation periods (500 ms). Vertical line in each of the raster displays and histograms indicates the stimulus onset. Calibration at the right bottom of the figure indicates the number of spikes per trial in each bin. Bin width = 50 ms. (B) Response magnitudes of the neuron shown in A to the 16 visual stimuli. The neuron responded most strongly to the snakes (***Tukey test after one-way ANOVA, P < 0.001).
Fig. 3.
Fig. 3.
Stereotaxic plots of the pulvinar neurons on the MRI photo of the monkey brain. The 745 pulvinar neurons were recorded from AP 8.0 to AP 5.0, but plotted on the plane at AP 7.0. The number in the left upper corner indicates the distance (in millimeters) anteriorly from the interaural line. The horizontal axis indicates the distance (in millimeters) from the midline; vertical axis indicates the distance (in millimeters) from the interaural line. Open circles, visually responsive neurons; dots, nonresponsive neurons.
Fig. 4.
Fig. 4.
Effects of scrambling and filtering of the images. (A) An example of neuronal responses to the original (a), scrambled (b), and filtered [c (LPF), d (HPF)] images (same neuron shown in Fig. 1). (B) Response magnitudes to the stimuli shown in A. Scrambling significantly decreased (***Tukey test after one-way ANOVA, P < 0.001) and HPF tended to decrease the responses to the original image (Tukey test after one-way ANOVA, P < 0. 10). (C) Mean response magnitudes to the scrambled and filtered images (n = 20). Scrambling and HPF significantly decreased the responses to the original image (***Tukey test after one-way ANOVA, P < 0.001).
Fig. 5.
Fig. 5.
Distributions of the 16 visual stimuli in a 2D space resulting from MDS using responses of the 91 neurons to these stimuli in epoch 1 (A), epoch 2 (B), and epoch 3 (C). In epochs 1 and 2 (A and B), the snakes were separated from the remaining stimuli. In epoch 3 (C), three groups were separated: snakes, hands, and a cluster containing the faces and simple geometrical shapes.

References

    1. Headland TN, Greene HW. Hunter-gatherers and other primates as prey, predators, and competitors of snakes. Proc Natl Acad Sci USA. 2011;108(52):E1470–E1474. - PMC - PubMed
    1. Isbell LA. The Fruit, the Tree, and the Serpent: Why We See so Well. Cambridge, MA: Harvard Univ Press; 2009.
    1. Henshilwood CS, et al. Emergence of modern human behavior: Middle Stone Age engravings from South Africa. Science. 2002;295(5558):1278–1280. - PubMed
    1. Texier P-J, et al. From the cover: A Howiesons Poort tradition of engraving ostrich eggshell containers dated to 60,000 years ago at Diepkloof Rock Shelter, South Africa. Proc Natl Acad Sci USA. 2010;107(14):6180–6185. - PMC - PubMed
    1. Isbell LA. Snakes as agents of evolutionary change in primate brains. J Hum Evol. 2006;51(1):1–35. - PubMed

Publication types