Case Reports
. 2013 Sep:111:70-92.

Evaluation of electronic health record implementation in ophthalmology at an academic medical center (an American Ophthalmological Society thesis)

Affiliations
Case Reports

Evaluation of electronic health record implementation in ophthalmology at an academic medical center (an American Ophthalmological Society thesis)

Michael F Chiang et al. Trans Am Ophthalmol Soc. 2013 Sep.

Abstract

Purpose: To evaluate three measures related to electronic health record (EHR) implementation: clinical volume, time requirements, and nature of clinical documentation. Comparison is made to baseline paper documentation.

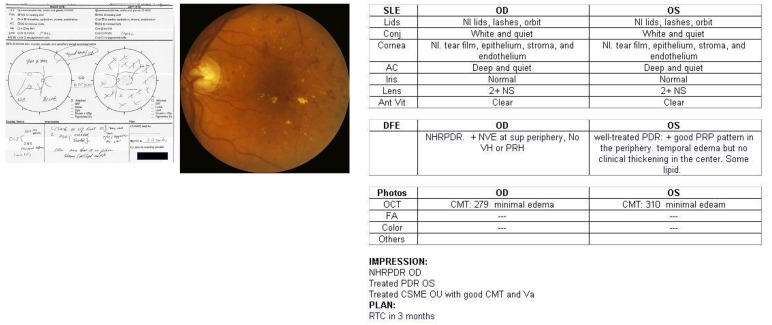
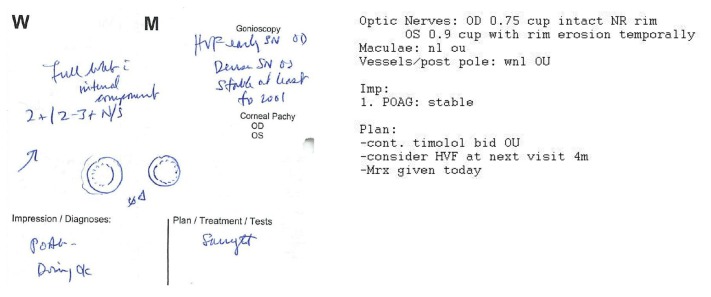
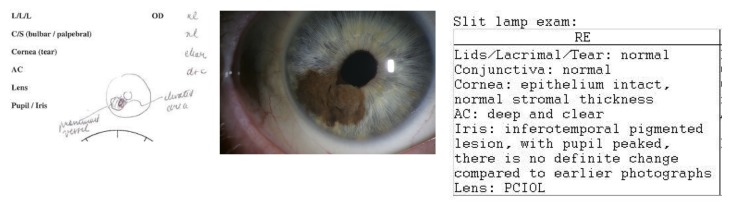
Methods: An academic ophthalmology department implemented an EHR in 2006. A study population was defined of faculty providers who worked the 5 months before and after implementation. Clinical volumes, as well as time length for each patient encounter, were collected from the EHR reporting system. To directly compare time requirements, two faculty providers who utilized both paper and EHR systems completed time-motion logs to record the number of patients, clinic time, and nonclinic time to complete documentation. Faculty providers and databases were queried to identify patient records containing both paper and EHR notes, from which three cases were identified to illustrate representative documentation differences.

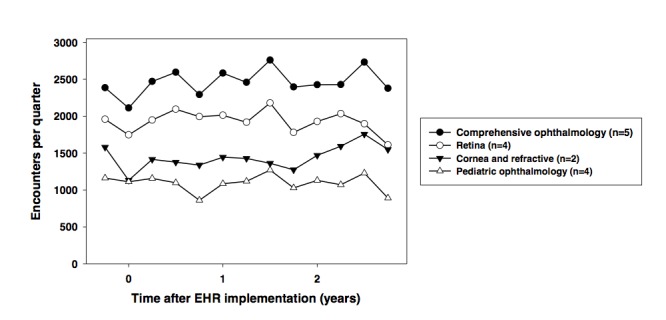
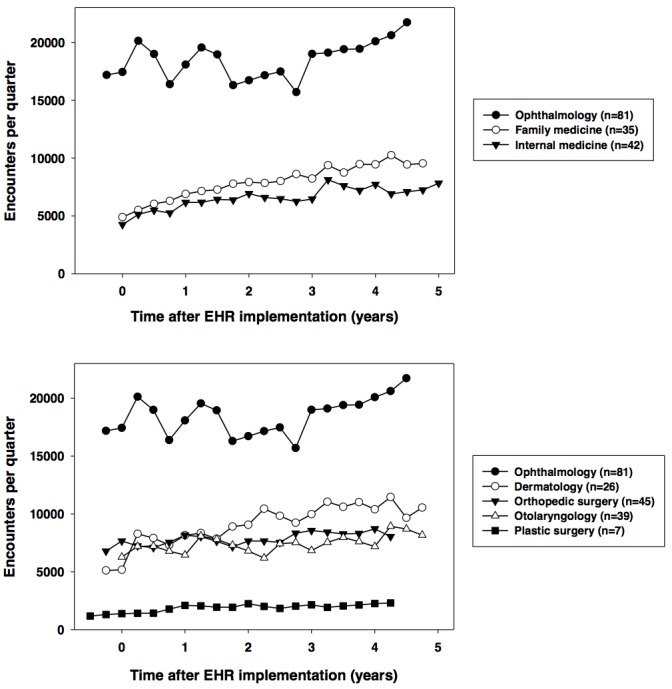
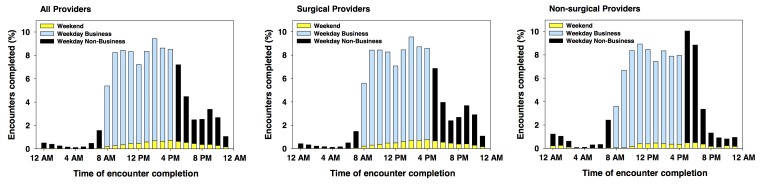
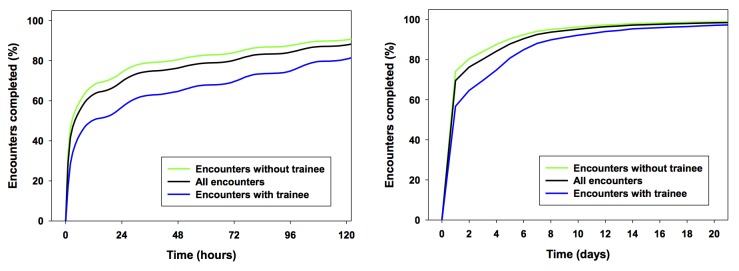
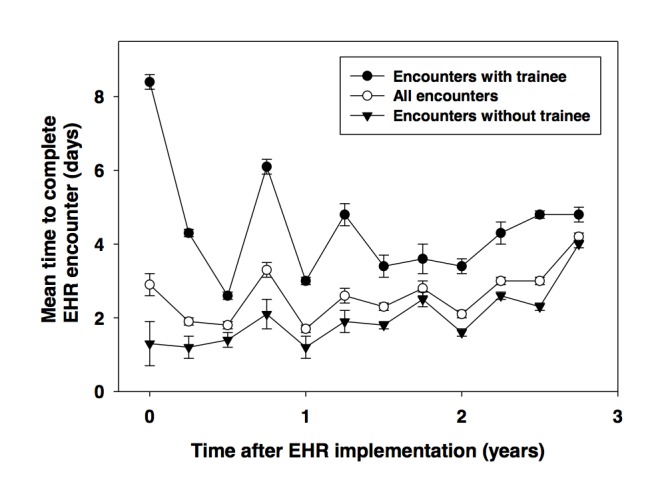
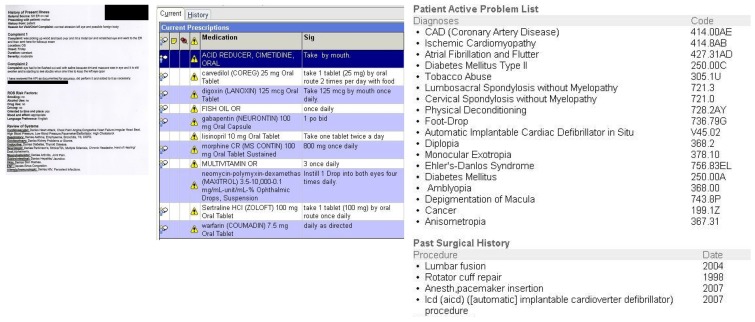
Results: Twenty-three faculty providers completed 120,490 clinical encounters during a 3-year study period. Compared to baseline clinical volume from 3 months pre-implementation, the post-implementation volume was 88% in quarter 1, 93% in year 1, 97% in year 2, and 97% in year 3. Among all encounters, 75% were completed within 1.7 days after beginning documentation. The mean total time per patient was 6.8 minutes longer with EHR than paper (P<.01). EHR documentation involved greater reliance on textual interpretation of clinical findings, whereas paper notes used more graphical representations, and EHR notes were longer and included automatically generated text.

Conclusion: This EHR implementation was associated with increased documentation time, little or no increase in clinical volume, and changes in the nature of ophthalmic documentation.


Figures

FIGURE 1
FIGURE 1
Quarterly patient volume over time of 23 stable faculty providers within an academic ophthalmology department after electronic health record (EHR) system implementation. Data are displayed for highest-volume (top), intermediate-volume (middle), and lowest-volume (bottom) ophthalmology divisions. One-quarter of baseline patient volume is shown using paper system before EHR implementation.
FIGURE 2
FIGURE 2
Quarterly patient volume over time of all faculty providers within an academic ophthalmology department after electronic health record (EHR) system implementation, compared to other fields. Data are displayed for family medicine and general internal medicine (top) and dermatology, orthopedic surgery, otolaryngology, and plastic surgery (bottom). Legends indicate total number of faculty providers who worked in each field at any time during entire period shown. Baseline patient volume is shown using paper system before EHR implementation when available.
FIGURE 3
FIGURE 3
Time of day for electronic health record (EHR) chart completion by 23 stable faculty providers within an academic ophthalmology department during 3 years after system implementation. Data are displayed for all providers (left), providers from surgical divisions (comprehensive ophthalmology, retina, cornea/refractive, pediatrics, oculoplastics, glaucoma) (center), and providers from nonsurgical divisions (uveitis, neuro-ophthalmology, low vision, genetics) (right). Among all providers, 68% of EHR charts were completed during traditional weekday business hours, 24% were completed during weekday nonbusiness hours (after 5 PM and before 8 AM), and 8% were completed on weekends.
FIGURE 4
FIGURE 4
Time required for electronic health record (EHR) chart completion by 23 stable faculty providers within an academic ophthalmology department during 3 years after system implementation. Scale is shown in hours (left) and days (right). Data are displayed for all encounters considered together, for encounters in which resident or fellow trainees were involved with clinical documentation, and for encounters in which trainees were not involved. Considering all providers together, 25% of EHR charts were completed within 52 minutes, 50% were completed within 3.9 hours, and 75% were completed within 1.7 days after beginning EHR documentation.
FIGURE 5
FIGURE 5
Trends in mean time required for electronic health record (EHR) chart completion by 23 stable faculty providers within an academic ophthalmology department during 3 years after system implementation. Data are displayed for all encounters considered together, for encounters in which resident or fellow trainees were involved with clinical documentation, and for encounters in which trainees were not involved. Error bars represent standard error of the mean. Among all 23 providers, time series regression analysis showed that median time increased by 9.6 minutes per month over this time period.
FIGURE 6
FIGURE 6
Example of clinical documentation of posterior segment ocular disease in paper vs EHR systems. Patient with diabetic retinopathy was examined and documented by the same faculty provider on different dates using the two systems. Left, paper documentation emphasizing structured checkboxes and annotated drawings. Right, EHR documentation emphasizing structured textual descriptions and interpretations (eg, disease classification and treatment response). Center, photographic documentation of clinical findings.
FIGURE 7
FIGURE 7
Example of clinical documentation of optic nerve disease in paper vs EHR systems. Patient with primary open-angle glaucoma was examined and documented by the same faculty provider on different dates using the two systems. Left, Paper documentation emphasizing written descriptions and annotated drawings. Right, EHR documentation emphasizing structured textual descriptions and interpretations of optic nerve findings.
FIGURE 8
FIGURE 8
Example of clinical documentation of anterior segment ocular disease in paper vs EHR systems. Patient with iris melanoma was examined and documented by the same faculty provider on different dates using the two systems. Top left, paper documentation emphasizing structured checkboxes and annotated drawings. Top right, EHR documentation emphasizing structured textual descriptions and interpretations (eg, comparison with previous examinations). Bottom, Photographic documentation of clinical findings.
FIGURE 9
FIGURE 9
Examples of clinical documentation challenges using EHR systems. Left, extensive automatically generated text for chief complaint, history of present illness, and review of systems. Center and right, problem lists and medication lists that combine systemic and ophthalmic issues.

References

    1. Greenes RA, Shortliffe EH. Medical informatics: an emerging academic discipline and institutional priority. JAMA. 1990;263(8):1114–1120. - PubMed
    1. Committee on Quality of Health Care in America, Institute of Medicine . To Err is Human: Building a Safer Health System. Washington, DC: National Academy Press; 2000. p. 1.
    1. Humphreys BL, McCutcheon DE. Growth patterns in the National Library of Medicine’s serials collection and in Index Medicus journals, 1966–1985. Bull Med Libr Assoc. 1994;82(1):18–24. - PMC - PubMed
    1. Kassirer JP. The next transformation in the delivery of health care. N Engl J Med. 1995;332(1):52–54. - PubMed
    1. Institute for Health and Aging, University of California, San Francisco . Chronic Care in America: A 21st Century Challenge. Princeton, NJ: Robert Wood Johnson Foundation; 1996. p. 13. Available at: www.rwjf.org/files/publications/other/ChronicCareinAmerica.pdf. Accessed May 6, 2011.

Publication types