Clinical Trial
. 2013 Oct 22;8(10):e78250.
doi: 10.1371/journal.pone.0078250. eCollection 2013.

Macrophage migration inhibitory factor and stearoyl-CoA desaturase 1: potential prognostic markers for soft tissue sarcomas based on bioinformatics analyses

Affiliations
Clinical Trial

Macrophage migration inhibitory factor and stearoyl-CoA desaturase 1: potential prognostic markers for soft tissue sarcomas based on bioinformatics analyses

Hiro Takahashi et al. PLoS One. .

Abstract

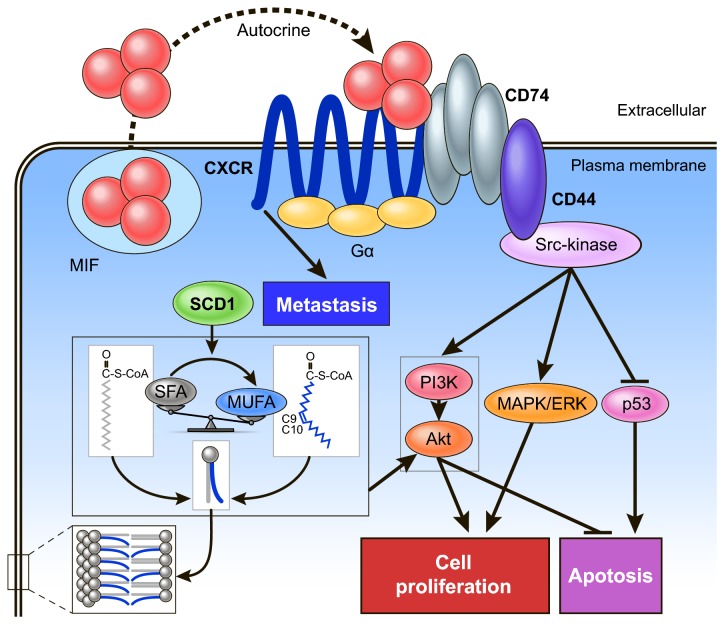
The diagnosis and treatment of soft tissue sarcomas (STSs) has been particularly difficult, because STSs are a group of highly heterogeneous tumors in terms of histopathology, histological grade, and primary site. Recent advances in genome technologies have provided an excellent opportunity to determine the complete biological characteristics of neoplastic tissues, resulting in improved diagnosis, treatment selection, and investigation of therapeutic targets. We had previously developed a novel bioinformatics method for marker gene selection and applied this method to gene expression data from STS patients. This previous analysis revealed that the extracted gene combination of macrophage migration inhibitory factor (MIF) and stearoyl-CoA desaturase 1 (SCD1) is an effective diagnostic marker to discriminate between subtypes of STSs with highly different outcomes. In the present study, we hypothesize that the combination of MIF and SCD1 is also a prognostic marker for the overall outcome of STSs. To prove this hypothesis, we first analyzed microarray data from 88 STS patients and their outcomes. Our results show that the survival rates for MIF- and SCD1-positive groups were lower than those for negative groups, and the p values of the log-rank test are 0.0146 and 0.00606, respectively. In addition, survival rates are more significantly different (p = 0.000116) between groups that are double-positive and double-negative for MIF and SCD1. Furthermore, in vitro cell growth inhibition experiments by MIF and SCD1 inhibitors support the hypothesis. These results suggest that the gene set is useful as a prognostic marker associated with tumor progression.


Conflict of interest statement

Competing Interests: The authors have declared that no competing interests exist.

Figures

Figure 1
Figure 1. A schematic of the simulation conducted based on the permutation test.
Clinical data for all patients were permutated. Permutated data for 35 STS patients (20 MFH patients and 15 MFS patients) were extracted from permutated data for all patients. For these data, p values (p 1) were calculated by applying Welch's t-test to the log-transformed gene expression data to discriminate between MFH and MFS. Otherwise, permutated data for 88 patients were used for survival analysis. For these data, p values (p 2) were calculated by applying log-rank test to the binarized gene expression data to analyze the outcome in the STS patient group. The integrated statistic p' was defined as p 1 × p 2. The lowest p' value was selected for each repetition. This procedure was repeated 100,000 times, and an empirical null distribution was constructed. Using the distribution, the actual p' value obtained from real data was converted to the corrected p value (based on the correction for multiple testing).
Figure 2
Figure 2. Discrimination between MFH and MFS by using expressions of MIF and SCD1.
Open square indicates MFS patient. Filled circle indicates MFH patient.
Figure 3
Figure 3. Kaplan-Meier curves and log-rank test for all STS patients.
(A) All STS patients (B) The MIF-positive group (MIF > 10171, median of MIF signals for 88 patients) consisted of 44 patients (red line) and the MIF-negative group consisted of 44 patients (black line). (C) The SCD1-positive group (SCD1 > 1879, median of SCD1 signals for 88 patients) consisted of 44 patients (red line) and of SCD1-negative group consisted of 44 patients (black line). (D) The MIF and SCD1 double-positive group (MIF > 10171 and SCD1 > 1879) consisted of 20 patients (red line), the MIF or SCD1 single-positive group consisted of 48 patients (black line), and the MIF and SCD1 double-negative group consisted of 20 patients (blue line). The p values were calculated by the log-rank test. a indicates the p value for the comparison of the double-positive vs. the double-negative groups.
Figure 4
Figure 4. The Kaplan-Meier curve and log-rank test for MLS patients.
The MIF and SCD1 double-positive group (MIF > 10171 and SCD1 > 1879) consisted of 2 patients (red line), the MIF or SCD1 single-positive group consisted of 13 patients (black line), and the MIF and SCD1 double-negative group consisted of 5 patients (blue line). The p value was calculated by the log-rank test.
Figure 5
Figure 5. Cell growth inhibitory effects of 4-IPP and A939572 for MuSS cell line.
(A) Inhibition of cell viability at varying concentrations of 4-IPP (MIF inhibitor) in MuSS cells relative to DMSO-treated control cells. (B) Inhibition of cell viability at varying concentrations of A939572 (SCD1 inhibitor) in MuSS cells relative to DMSO-treated control cells. (C) Inhibition of cell viability by DMSO only (control), 15 µM MIF inhibitor, 50 nM SCD1 inhibitor, and the combination of 15 µM MIF inhibitor and 50 nM SCD1 inhibitor in MuSS cells relative to DMSO-treated control cells. Data are shown for cells treated for 24 h in media containing 2% FBS. Cell viability was determined using the MTT assay in 3 independent replicates at each dose level. Error bars represent the SD from the mean. * indicates p < 0.05 (p value was calculated by Welch’s t-test and corrected by Bonferroni correction for multiple testing).
Figure 6
Figure 6. Hypothetical regulation model for metabolic and signaling control by MIF and SCD1.
MUFA, monounsaturated fatty acids; SFA, saturated fatty acids; SCD1, stearoyl-CoA desaturase 1; MIF, macrophage migration inhibitory factor; CXCR, CXC chemokine receptor; PI3K, phosphoinositide 3-kinase; MAPK, extracellular signal-regulated kinase; ERK, mitogen-activated protein kinase.

References

    1. Gatta G, van der Zwan JM, Casali PG, Siesling S, Dei Tos AP et al. (2011) Rare cancers are not so rare: the rare cancer burden in Europe. Eur J Cancer 47: 2493-2511. doi:10.1016/j.ejca.2011.08.008. PubMed: 22033323. - DOI - PubMed
    1. Gustafson P (1994) Soft tissue sarcoma. Epidemiology and prognosis in 508 patients. Acta Orthop Scand Suppl 259: 1-31. PubMed: 8042499. - PubMed
    1. Fletcher CDM, Unni KK, Mertens F, editors (2002) Pathology and Genetics of Tumors of Soft Tissue and Bone. Lyon: IARC Press.
    1. Nakayama R, Nemoto T, Takahashi H, Ohta T, Kawai A et al. (2007) Gene expression analysis of soft tissue sarcomas: characterization and reclassification of malignant fibrous histiocytoma. Mod Pathol 20: 749-759. doi:10.1038/modpathol.3800794. PubMed: 17464315. - DOI - PubMed
    1. Takahashi H, Kobayashi T, Honda H (2005) Construction of robust prognostic predictors by using projective adaptive resonance theory as a gene filtering method. Bioinformatics 21: 179-186. doi:10.1093/bioinformatics/bth473. PubMed: 15308545. - DOI - PubMed

Publication types

MeSH terms