. 2014 Feb;175(2):246-57.
doi: 10.1111/cei.12230.

Lack of host gut microbiota alters immune responses and intestinal granuloma formation during schistosomiasis

Affiliations

Lack of host gut microbiota alters immune responses and intestinal granuloma formation during schistosomiasis

M Holzscheiter et al. Clin Exp Immunol. 2014 Feb.

Abstract

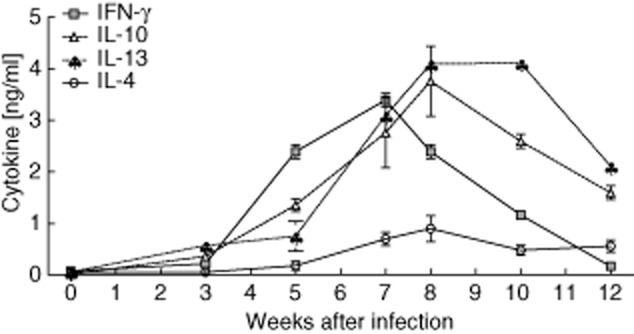
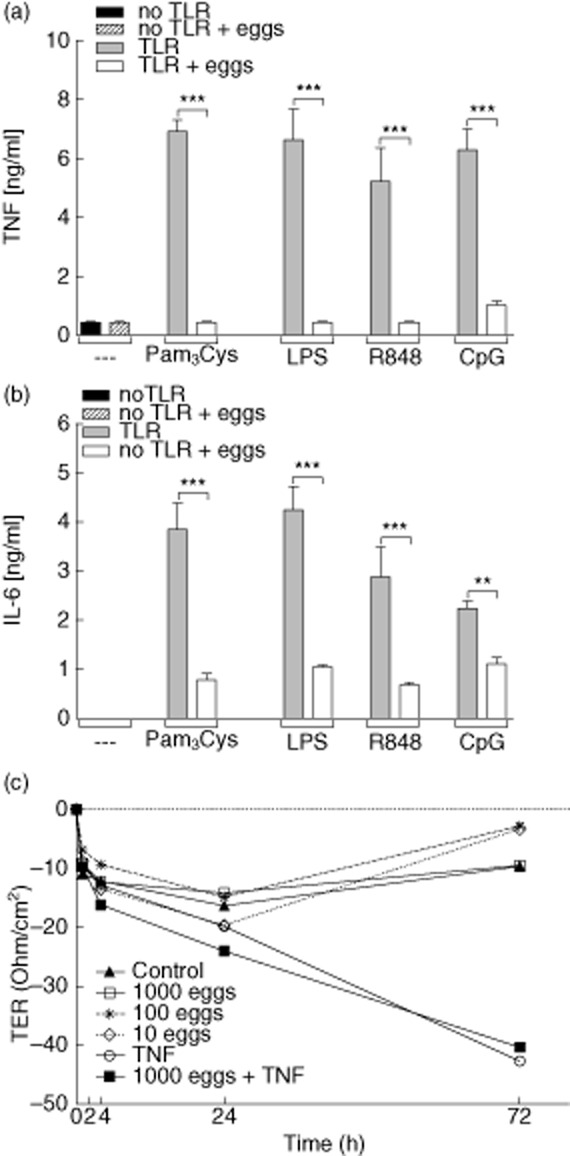
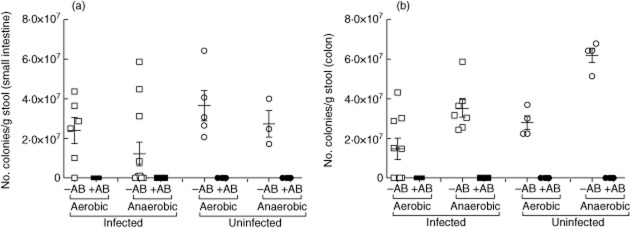
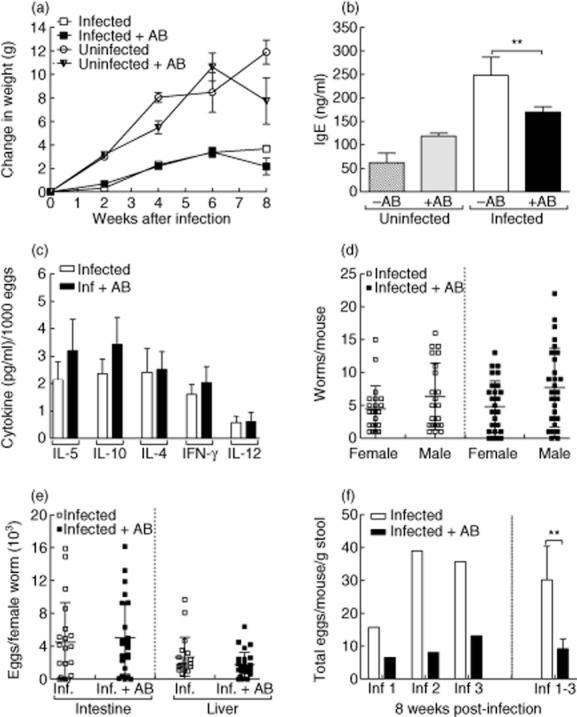
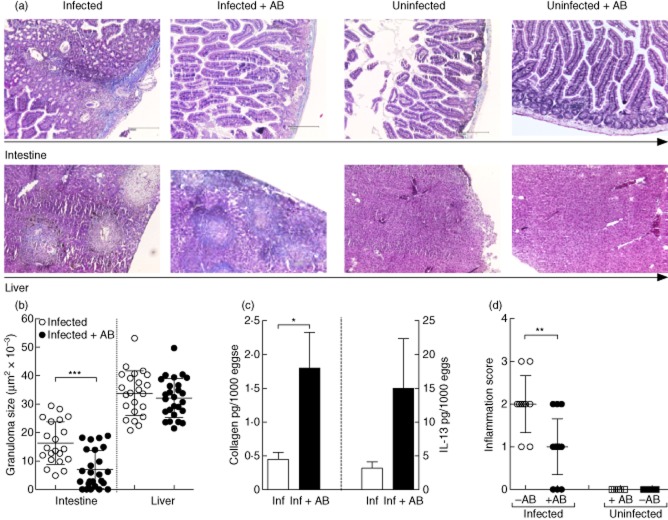
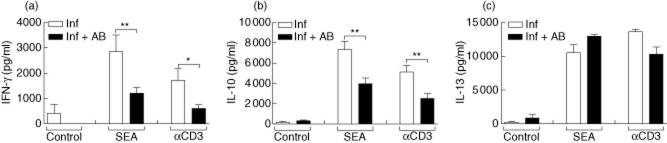
Fatalities from schistosome infections arise due to granulomatous, immune-mediated responses to eggs that become trapped in host tissues. Schistosome-specific immune responses are characterized by initial T helper type 1 (Th1) responses and our previous studies demonstrated that myeloid differentiation primary response gene 88 (Myd88)-deficient mice failed to initiate such responses in vivo. Paradoxically, schistosomal antigens fail to stimulate innate cells to release proinflammatory cytokines in vitro. Since Schistosoma mansoni infection is an intestinal disease, we hypothesized that commensal bacteria could act as bystander activators of the intestinal innate immune system to instigate Th1 responses. Using a broad spectrum of orally administered antibiotics and anti-mycotics we analysed schistosome-infected mice that were simultaneously depleted of gut bacteria. After depletion there was significantly less inflammation in the intestine, which was accompanied by decreased intestinal granuloma development. In contrast, liver pathology remained unaltered. In addition, schistosome-specific immune responses were skewed and faecal egg excretion was diminished. This study demonstrates that host microbiota can act as a third partner in instigating helminth-specific immune responses.

Keywords: Host-parasite interaction; Th responses; gut-microbiota; immunopathology; schistosomiasis.


Figures

Fig. 1
Fig. 1
Immune responses to schistosomal antigens in vivo and in vitro. C57BL/6 mice were infected with Schistosoma mansoni for 12 weeks. At time-points 0, 3, 5, 7, 8, 10 and 12 weeks post-infection, draining mesenteric lymph nodes (MLN) were restimulated ex vivo with soluble egg antigen (SEA). After 72 h, the supernatants were removed and analysed for cytokine concentrations via enzyme-linked immunosorbent assay (ELISA). The symbols represent the mean ± standard deviation of six individually assessed mice in two independent infection studies.
Fig. 2
Fig. 2
Schistosome eggs suppress innate immune responses and are incapable of disrupting epithelial cell layers in vitro. (a,b) Dendritic cells from C57BL/6 mice were generated from bone marrow cells using granulocyte–macrophage colony-stimulating factor (GM-CSF). After 7 days, dendritic cells (DC) (2 × 10⁵) were co-cultured with 400 viable eggs for 2 h. Thereafter, cells were stimulated with either Pam3Cys, lipopolysaccharide (LPS), R848 or cytosine–phosphate–guanosine (CpG). After an additional 48 h, culture supernatants were removed and analysed for the production of tumour necrosis factor (TNF) (a) and interleukin (IL)-6 (b) via enzyme-linked immunosorbent assay (ELISA). Bars represent mean ± standard deviation (s.d.) of three pooled experiments. (c) Eggs were placed with or without TNF into the upper chamber of an in-vitro system resembling the intestinal epithelium. Epithelial integrity was then monitored at the indicated time-points by measuring the resistance of the epithelial cell layer [transepithelial electrical resistance (TER)]. Symbols represent pooled data from two independent assays. Asterisks indicate significant differences using one-way analysis of variance (anova) (**P < 0·01; ***P < 0·001).
Fig. 3
Fig. 3
Successful depletion of commensal flora during Schistosoma infection. Groups of S. mansoni-infected or non-infected mice were or were not treated orally 6 weeks post-infection with a broad spectrum antibiotic cocktail (closed and open symbols, respectively). At the eighth week of infection, mice were analysed for the presence of bacteria in the small (a) and large (b) bowel. In brief, the stool content of individual mice was plated on solid agar plates and cultivated for 48 h. Graphs show the number of aerobic and anaerobic colonies per gram stool [mean ± standard deviation (s.d.)] per mouse. Open symbols represent untreated mice (–AB) and closed symbols show antibiotic-treated (+AB) mice. The data shown are representative of one of four separate infection-depleted experiments.
Fig. 4
Fig. 4
Assessment of infection parameters upon administration of antibiotics. Groups of C57BL/6 mice were infected with Schistosoma mansoni. Between weeks 6–8 post-infection, groups of infected and non-infected control mice were treated with antibiotics. (a) Throughout infection, mice were weighed on a fortnightly basis to observe any alterations in their general health. Symbols represent the change in weight [mean ± standard error of the mean (s.e.m.)] of five mice per group. Data represent one experiment of three. (b) Levels of total immunoglobulin (Ig)E were determined in the sera of individual mice by enzyme-linked immunosorbent assay (ELISA). Bars represent mean ± standard deviation (s.d.) of individual mice from three independent experiments (–AB n = 14 and +AB n = 20). (c) In-situ cytokine levels [interleukin (IL)-5, IL-10, IL-4, interferon (IFN)-γ and IL-12] were measured in homogenized liver samples obtained from 8-week-infected mice by ELISA. Levels were then calculated on individual egg burden in the liver. Bars represent the mean ± s.e.m. of individually assessed mice from four independent experiments (–AB n = 22 and +AB n = 28). (d) Worm burden was calculated following liver perfusion and microscopic examination of infected organs. Symbols represent mean ± s.d. of worm burden per mouse from four independent experiments (–AB n = 22 and +AB n = 28). (e) To determine fecundity, the amount of eggs in the infected tissues was calculated following organ digestion with potassium hydroxide (KOH). Symbols represent the mean ± s.d. of eggs per female worm in individual mice from four independent experiments (–AB n = 22 and +AB n = 28). (f) Eggs secreted in the stool were measured after 8 weeks of infection. The data show egg load per mouse from three independent experiments (Inf 1, 2 and 3). On the right-hand side of the graph, bars represent the mean ± s.d. of the three experiments pooled together. Asterisks indicate a significant difference (** P < 0·01) between the indicated groups following t-test analysis.
Fig. 5
Fig. 5
Infected antibody-treated mice present reduced intestinal inflammation and granuloma formation but elevated collagen levels in hepatic granulomas. (a) Histological sections were prepared from the intestines (upper panel) or liver (lower panel) from control and 8-week-infected mice and stained with Masson's Blue. Magnification was ×40 of equally sized sections. Organ sections from infected mice are depicted far left; infected and antibiotic treatment groups, left; naive mice, right; and naive mice treated with antibiotics, far right. (b) From four independent infection studies, the average size of 35 liver granulomas and up to 15 intestinal granulomas were measured in each infected mouse. Symbols represent mean ± standard deviation (s.d.) of individual mice (–AB n = 22 and +AB n = 28). (c) The amount of collagen was determined in individual liver samples using the Biocolor assay kit and then correlated to the number of eggs found in the livers of the corresponding mice. The results shown are the mean ± s.d. obtained from individual mice from two independent infection experiments. In-situ levels of interleukin (IL)-13 were measured in the supernatants of liver homogenates at the time of analysis by enzyme-linked immunosorbent assay (ELISA). Bars represent the mean ± standard deviation (s.d.) of individual mice from three independent infection studies. (d) Semi-quantitative pathological assessment of intestinal inflammation. In a blind fashion, intestinal sections from individual mice were assessed for their level of inflammation (0 = absent; 1 = mild, 2 = moderate inflammation and 3 = strong inflammation). Symbols represent mean ± standard deviation (s.d.) of Inf. n = 10; Inf + AB n = 15; naive n = 5 and naive + AB n = 5). Asterisks indicate a significant difference (*P < 0·05; **P < 0·01; ***P < 0·001) between the indicated groups following analysis of variance (anova) or t-test analysis.
Fig. 6
Fig. 6
Altered schistosome-specific immune responses in antibody-treated Schistosoma mansoni-infected mice. Mesenteric lymph nodes (MLN) cells from uninfected or S. mansoni-infected mice, with or without antibody treatment, were restimulated in vitro with soluble egg antigen (SEA) (25 μg/ml) or αCD3 (1 μg/ml) for 72 h. Thereafter, the cytokines (a) interferon (IFN)-γ, (b) interleukin (IL)-10 and (c) IL-13 were measured in the supernatant by enzyme-linked immunosorbent assay (ELISA). Bars represent the mean ± standard deviation (s.d.) of individually tested mice from two independent experiments. Asterisks indicate significant differences (*P < 0·05; **P < 0·01).

References

    1. Pearce EJ, MacDonald AS. The immunobiology of schistosomiasis. Nat Rev Immunol. 2002;2:499–511. - PubMed
    1. Wilson MS, Mentink-Kane MM, Pesce JT, et al. Immunopathology of schistosomiasis. Immunol Cell Biol. 2007;85:148–154. - PMC - PubMed
    1. Wilson S, Vennervald BJ, Kadzo H, et al. Health implications of chronic hepatosplenomegaly in Kenyan school-aged children chronically exposed to malarial infections and Schistosoma mansoni. Trans R Soc Trop Med Hyg. 2010;104:110–111. - PMC - PubMed
    1. Mountford AP, Coulson PS, Pemberton RM, et al. The generation of interferon-gamma-producing T lymphocytes in skin-draining lymph nodes, and their recruitment to the lungs, is associated with protective immunity to Schistosoma mansoni. Immunology. 1992;75:250–256. - PMC - PubMed
    1. Wynn TA, Oswald IP, Eltoum IA, et al. Elevated expression of Th1 cytokines and nitric oxide synthase in the lungs of vaccinated mice after challenge infection with Schistosoma mansoni. J Immunol. 1994;153:5200–5209. - PubMed

Publication types

MeSH terms