. 2013 Nov 13;135(45):16766-9.
doi: 10.1021/ja407867a. Epub 2013 Oct 31.

Fluorogenic, two-photon-triggered photoclick chemistry in live mammalian cells

Affiliations

Fluorogenic, two-photon-triggered photoclick chemistry in live mammalian cells

Zhipeng Yu et al. J Am Chem Soc. .

Abstract

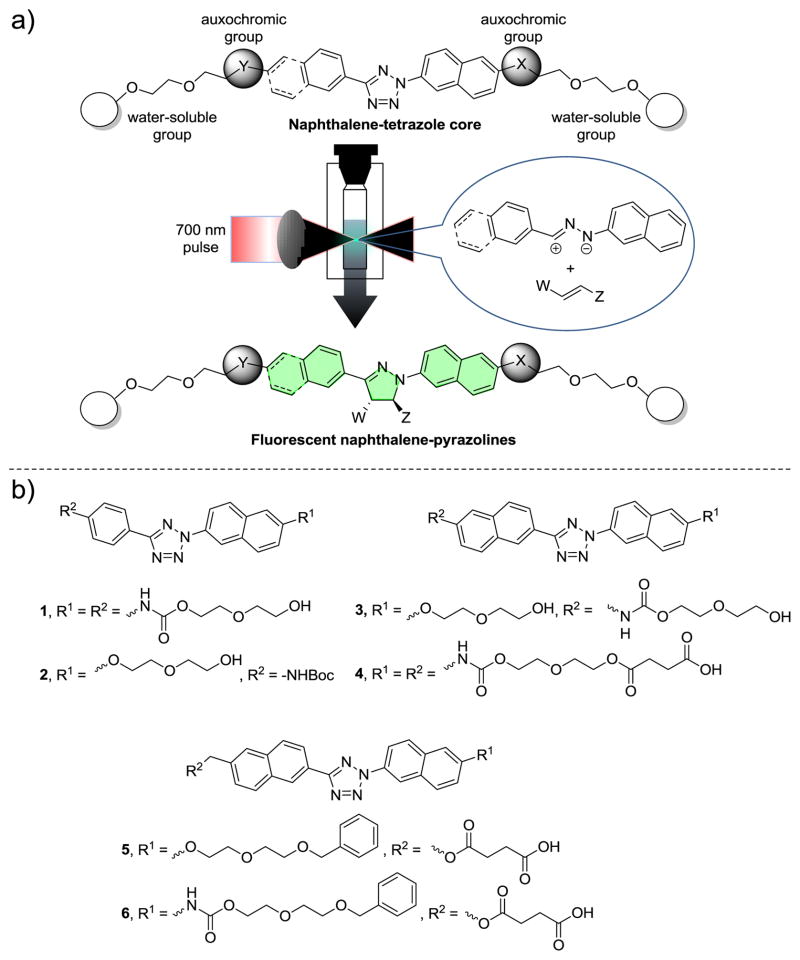
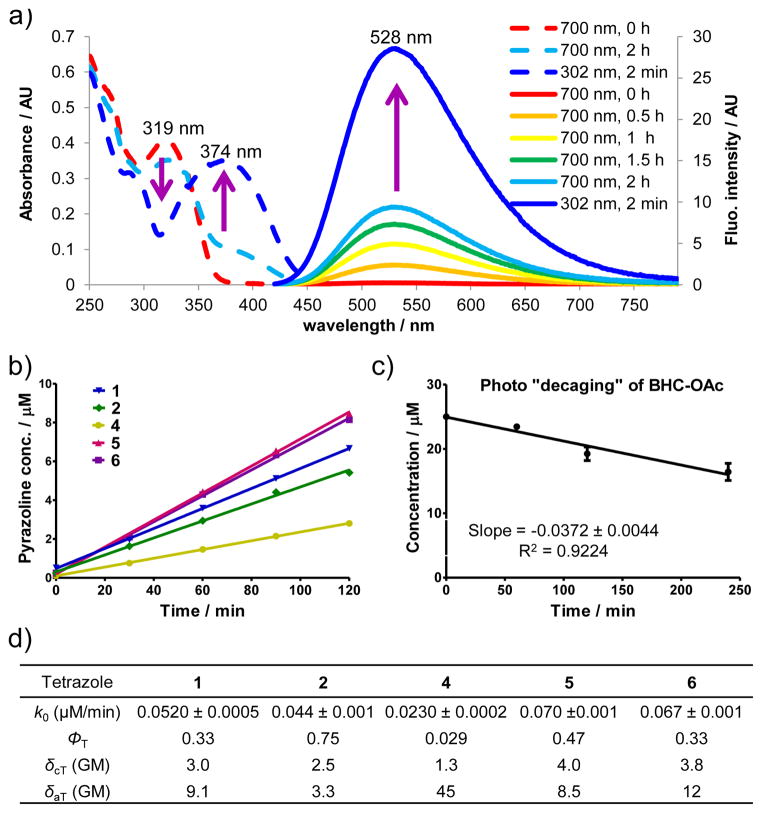
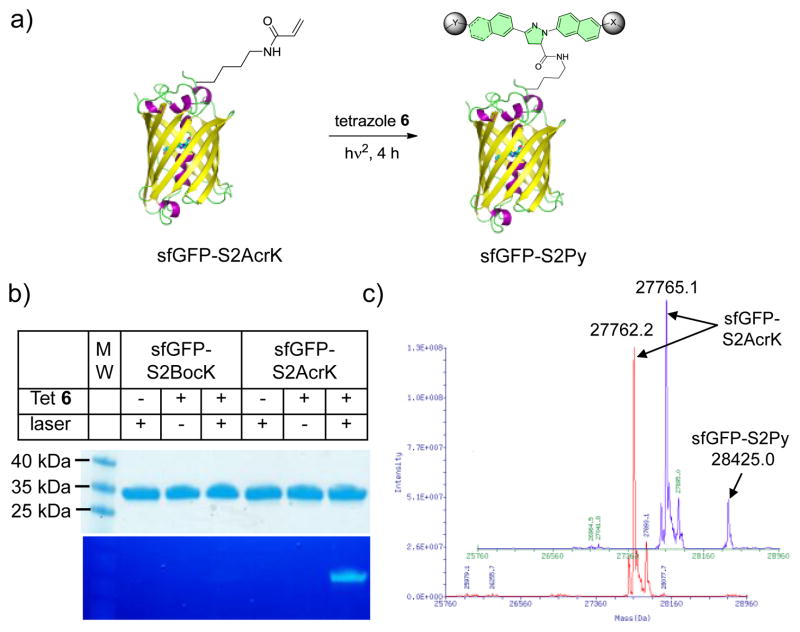
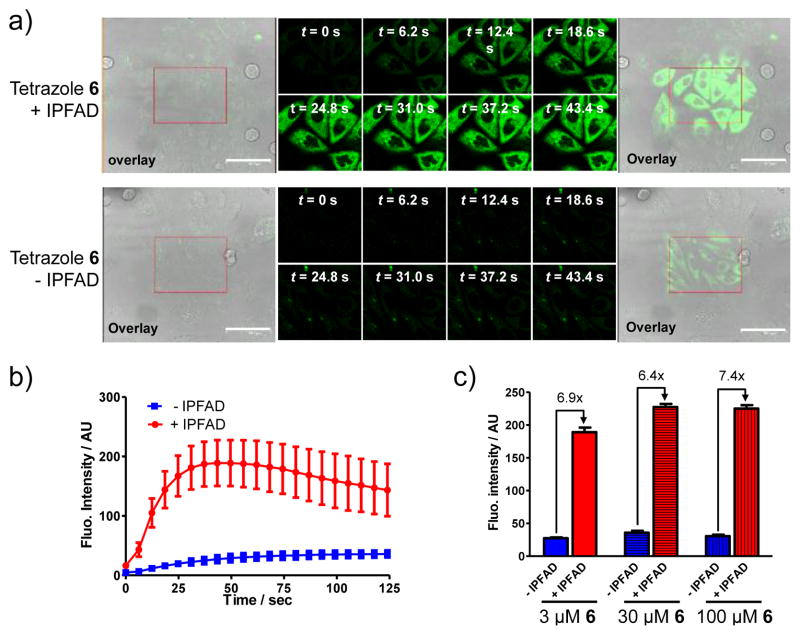
The tetrazole-based photoclick chemistry has provided a powerful tool to image proteins in live cells. To extend photoclick chemistry to living organisms with improved spatiotemporal control, here we report the design of naphthalene-based tetrazoles that can be efficiently activated by two-photon excitation with a 700 nm femtosecond pulsed laser. A water-soluble, cell-permeable naphthalene-based tetrazole was identified that reacts with acrylamide with the effective two-photon cross-section for the cycloaddition reaction determined to be 3.8 GM. Furthermore, the use of this naphthalene-tetrazole for real-time, spatially controlled imaging of microtubules in live mammalian cells via the fluorogenic, two-photon-triggered photoclick chemistry was demonstrated.


Figures

Figure 1
Figure 1
Design of naphthalene-tetrazoles for fluorogenic, two-photon-triggered photoclick chemistry. (a) General features of the naphthalene-tetrazoles and scheme of fluorogenic, two-photon-triggered photoclick chemistry. (b) Chemical structures of the naphthalene-tetrazoles 1–6 used in this study.
Figure 2
Figure 2
Determining tetrazole two-photon absorption cross section and two-photon cycloaddition cross-section. (a) UV-Vis (dash line) and fluorescence spectra (solid line) monitoring of the cycloaddition reaction between 25 μM tetrazole 6 and 2.5 mM acrylamide in acetonitrile/PBS (1:1) under 700 nm femtosecond pulsed laser irradiation. For fluorescence measurement, λex = 405 nm. (b) Plot of the pyrazoline cycloadduct formation over 120 min of 700 nm femtosecond pulsed laser irradiation. Tetrazole 3 was not included because of its insufficient solubility in acetonitrile/PBS (1:1). (c) Plot of the time course of photo-decaging of BHC-OAc upon 740 nm femtosecond pulsed laser irradiation. (d) Kinetic and photophysical data for naphthalene-tetrazoles in the two-photon triggered photoclick chemistry. The two-photon cross section of the cycloaddition reaction, δcT, and two-photon absorption cross section, δaT, were measured in GM (10−50 cm4s/photon).
Figure 3
Figure 3
Selective femtosecond pulsed laser induced fluorogenic labeling of sfGFP-S2AcrK by tetrazole 6 in vitro. (a) Reaction scheme. A solution of 10 μM sfGFP-S2AcrK and 200 μM tetrazole 6 in PBS buffer in a quartz cuvette was irradiated with a 700 nm femtosecond laser for 4 h. (b) Coomassie blue stain (top panel) and in-gel fluorescence (bottom panel) of the same protein gel after the reaction mixtures were resolved by SDS-PAGE. (c) De-convoluted mass spectra of sfGFP-S2AcrK (in red) and the product (in blue) showing the formation of the pyrazoline adduct.
Figure 4
Figure 4
Fluorescence microscopy of the fluorogenic, two-photon triggered photoclick chemistry in CHO cells. (a) Fluorescence/DIC overlap image before photoirradiation (panel 1), time-lapsed fluorescence images (panels 2–9) and fluorescence/DIC overlap image after photoirradiation (panel 10). CHO cells were treated with 3 μM tetrazole 6 in the presence (top row) or absence (bottom row) of 40 μM IPFAD followed by photoillumination of the red rectangle area with a 700 nm femtosecond pulsed laser. Scale bar = 61.3 μm. (b) Time courses of fluorescence development in ten cytosolic regions in selected CHO cells; red curve denotes the regions in the IPFAD-treated cells while blue curves denote the regions in the untreated cells. The concentrations of tetrazole 6 and IPFAD were 3 μM and 40 μM, respectively. (c) Effect of tetrazole 6 concentration on fluorescence intensity monitored by confocal microscopy. See Figure S21 for details.

References

    1. Helmchen F, Denk W. Nat Methods. 2005;2:932–940. - PubMed
    1. Zhu MQ, Zhang GF, Li C, Aldred MP, Chang E, Drezek RA, Li AD. J Am Chem Soc. 2011;133:365–372. - PubMed
    1. Bort G, Gallavardin T, Ogden D, Dalko PI. Angew Chem Int Ed. 2013;52:4526–4537. and references therein. - PubMed
    1. Furuta T, Wang SSH, Dantzker JL, Dore TM, Bybee WJ, Callaway EM, Denk W, Tsien RY. Proc Natl Acad Sci USA. 1999;96:1193–1200. - PMC - PubMed
    1. Lim RK, Lin Q. Acc Chem Res. 2011;44:828–839. - PMC - PubMed
    2. Wang Y, Hu WJ, Song W, Lim RKV, Lin Q. Org Lett. 2008;10:3725–3728. - PubMed
    3. Yu Z, Ho LY, Wang Z, Lin Q. Bioorg Med Chem Lett. 2011;21:5033–5036. - PMC - PubMed

Publication types