. 2012;3(1):52-61.
doi: 10.1080/17588928.2011.613988. Epub 2011 Oct 12.

Rapid decision-making under risk

Affiliations

Rapid decision-making under risk

Robert Adam et al. Cogn Neurosci. 2012.

Abstract

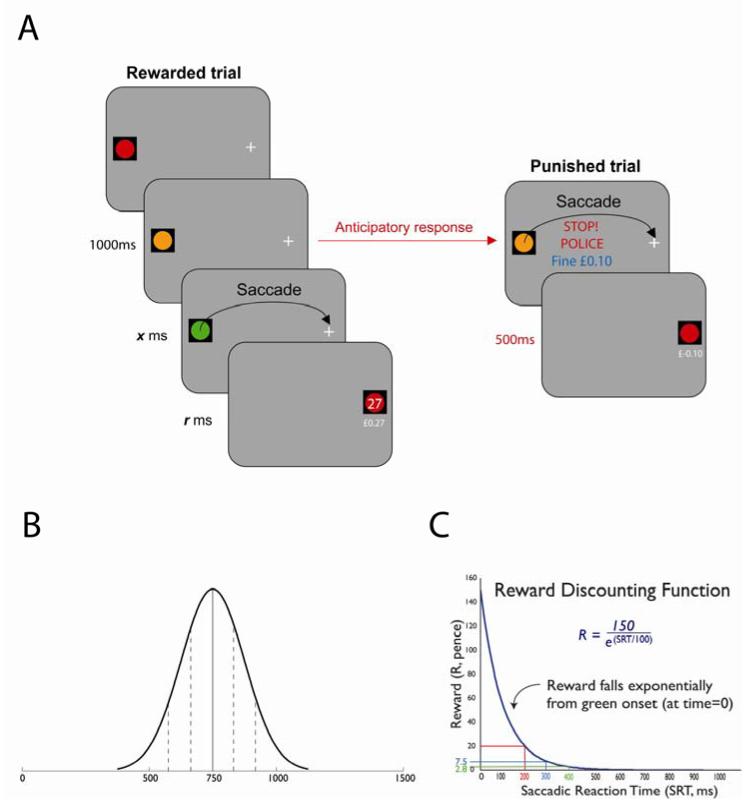
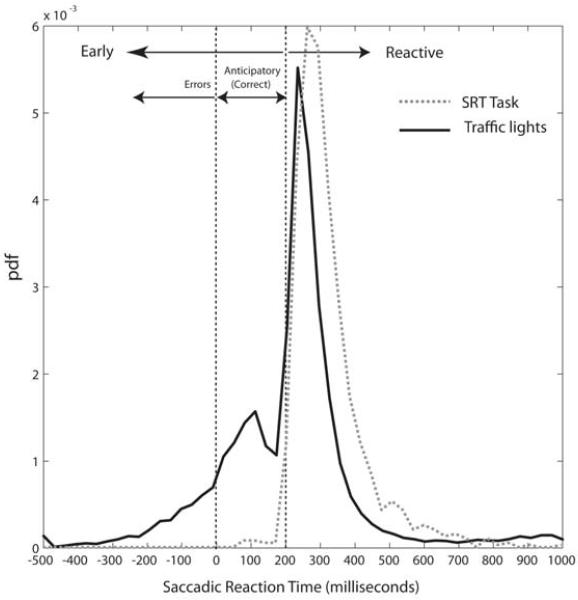
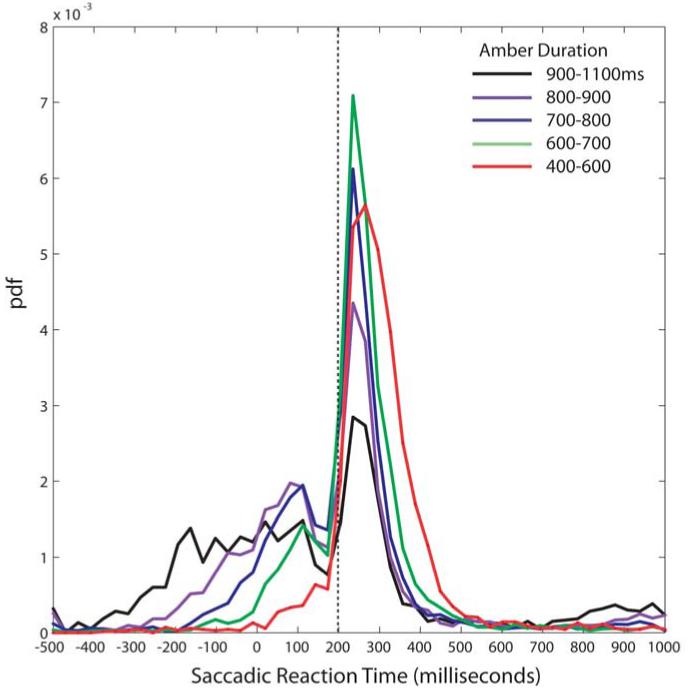
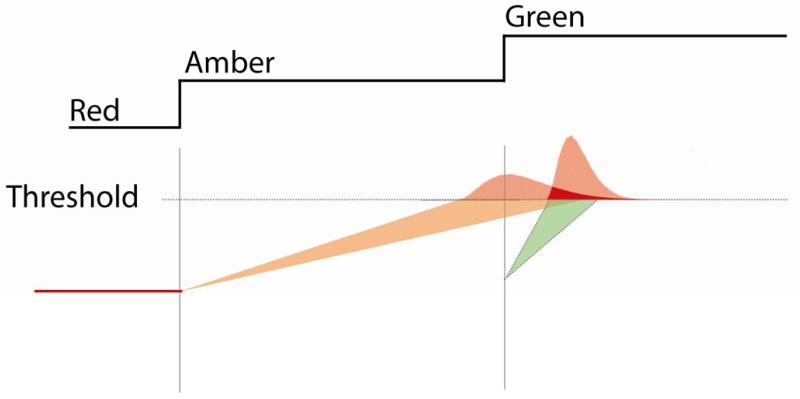
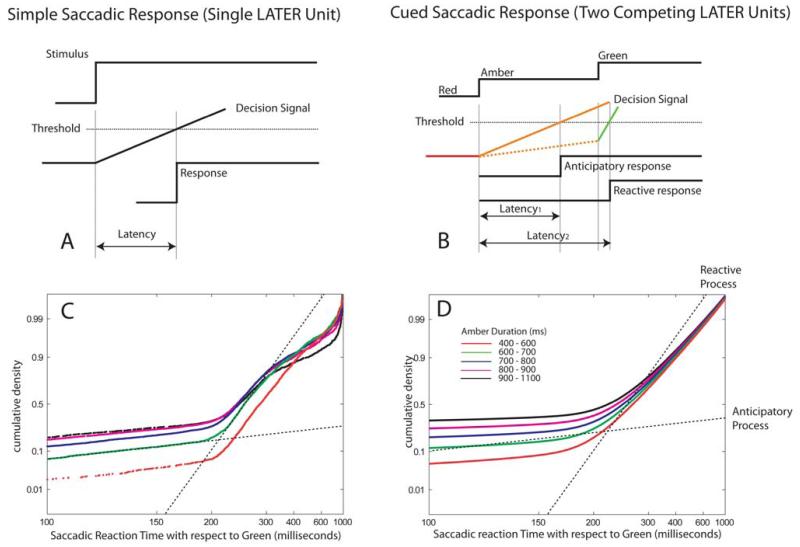
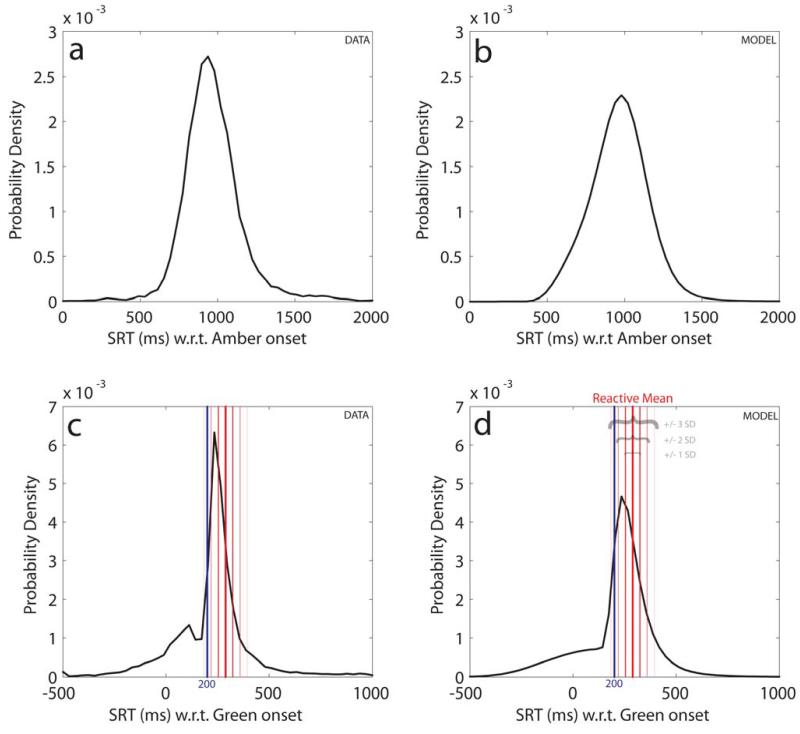
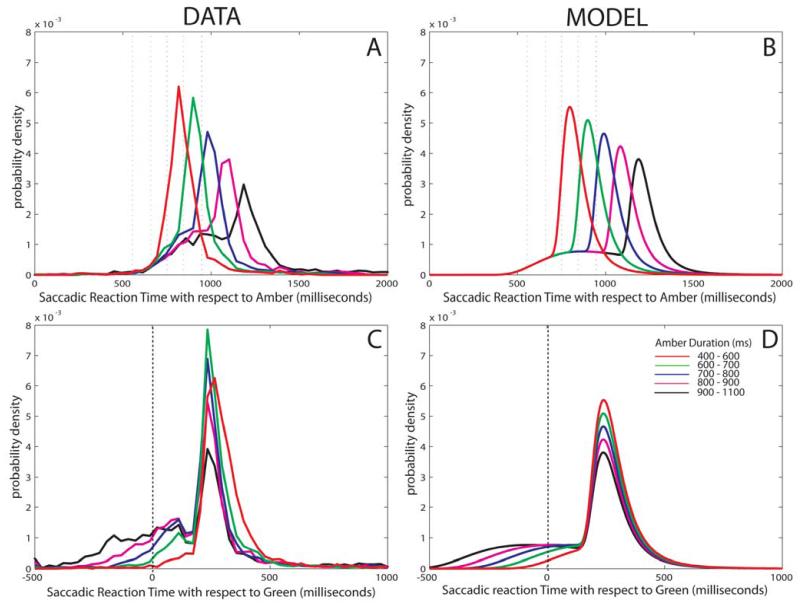
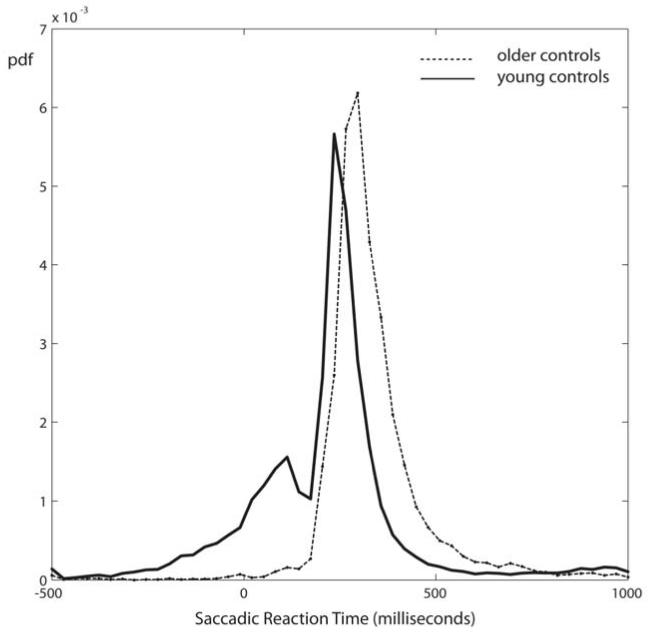
Impulsivity is often characterized by rapid decisions under risk, but most current tests of decision-making do not impose time pressures on participants' choices. Here we introduce a new traffic lights test which requires people to choose whether to program a risky, early eye movement before a traffic light turns green (earning them high rewards or a penalty) or wait for the green light before responding to obtain a small reward instead. Young participants demonstrated bimodal responses: an early, high-risk and a later, low-risk set of choices. By contrast, elderly people invariably waited for the green light and showed little risk-taking. Performance could be modeled as a race between two rise-to-threshold decision processes, one triggered by the green light and the other initiated before it. The test provides a useful measure of rapid decision-making under risk, with the potential to reveal how this process alters with aging or in patient groups.


Figures

Figure 1
Figure 1
The Traffic Light Task A Subjects were instructed to move their eyes as quickly as possible from a traffic light stimulus to a target cross. Saccades made after the green light were rewarded but those executed before the green light incurred a small penalty. B Amber duration was randomly selected on each trial from a normal distribution (mean 750ms, SD 125ms). C Reward was computed by a steep discounting function of saccadic reaction time. The biggest reward was for saccades that coincided with green light onset, but such saccades would have to been programmed before the green light.
Figure 2
Figure 2
Control saccadic reaction time (SRT) task response distribution for young controls. Participants showed a typical, positively skewed, “recinormal” distribution of saccadic latencies. pdf = probability distribution function.
Figure 3
Figure 3
Traffic Light Task response distributions for young controls. A bimodal distribution was apparent consisting of a population ‘early’ (anticipatory) saccades and ‘late’ (reactive) saccades. The latter were of similar latency to those seen in the SRT task. pdf = probability distribution function.
Figure 4
Figure 4
Saccadic response distributions varied with amber duration Displaying the probability density function (pdf) according to the amber duration in each trial reveals two important features of the task response First, the longer the amber duration, the more likely is an early, anticipatory saccade. Second, the latency of the reactive distribution is appears constant for all amber durations. Zero refers to green light onset.
Figure 5
Figure 5
How two LATER Units might describe the observed data. It is assumed that a certain decision threshold must be reached to initiate a saccade. This threshold may be reached through two forms of ‘evidence’. As time passes following the amber onset, there is increasing expectation of the green light. This form of evidence is accrued slowly. Once the green light is lit, there is 100% evidence of the requirement for a saccade, so a faster decision process is initiated. Depending upon the amber duration and prior knowledge of the amber duration distribution, one process will win the race on any given trial. As these are biological systems, there is also noise (variability) in the rate of rise of each process. This results in a recinormal distribution of saccadic latencies even in the presence of identical trial conditions.
Figure 6
Figure 6
Young volunteer data modeled as two linear rise-to-threshold processes. (A) Linear rise-to-threshold models predict simple saccadic response distributions. (B) We used a model which incorporates two LATER units to estimate means and variances for both reactive and anticipatory response distributions. In this case, saccadic latency depends upon the slope of each linear rising process (and the variability of the slope of each process from trial to trial). For short amber durations, the reactive process, which is steep, will usually reach threshold first (denoted by green line). For longer amber durations, however, the anticipatory process (amber line) triggered by amber onset may reach threshold before the reactive process does. In this example an error occurred because the amber-triggered process reached threshold before green onset. (C) Plotting responses on reciprobit axes demonstrates the existence of the two linear rise-to-threshold processes, one starting at amber onset (anticipatory), the other in response to green onset (reactive). (D) The gradients and variabilities of these processes were estimated using maximum likelihood estimation and used to parameterize two separate LATER units to model the distributions.
Figure 7
Figure 7
Saccadic response distributions and model distributions. Raw data (left panels) and modelled probability distributions (right panels) derived from four parameters (gradient and variance for two rise-to-threshold processes) estimated by maximum likelihood estimation. Plotted with respect to amber onset (a & b), there is a single homogeneous distribution of saccades. However, plotted with respect to the green light onset, the true bimodal distribution is revealed (c & d).
Figure 8
Figure 8
Saccade distributions as a function of amber duration: data and model findings. Using maximum likelihood estimation to estimate means and standard deviations for two recinormal distributions, the data (A & C) is well modeled (B & D). Note how the anticipatory component increases with amber duration.
Figure 9
Figure 9
Traffic Light Task saccadic distributions in older volunteers Older controls showed little or no anticipation despite a similar reactive distribution latency to young controls. The distribution more closely resembles that generated by young controls in the SRT task. Data for young controls on the traffic lights task is shown here by the dashed line.

References

    1. Aragues M, Jurado R, Quinto R, Rubio G. Laboratory Paradigms of Impulsivity and Alcohol Dependence: A Review. Eur Addict Res. 2011;17:64–71. - PubMed
    1. Bechara A, Damasio H, Tranel D, Anderson SW. Dissociation Of Working Memory from Decision Making within the Human Prefrontal Cortex. J. Neurosci. 1998;18:428–437. - PMC - PubMed
    1. Bickel WK, Odum AL, Madden GJ. Impulsivity and cigarette smoking: delay discounting in current, never, and ex-smokers. Psychopharmacology. 1999;146:447–454. - PubMed
    1. Brown SBRE, Ridderinkhof KR. Aging and the neuroeconomics of decision making: A review. Cognitive, Affective, & Behavioral Neuroscience. 2009;9:365–379. - PubMed
    1. White CT, Eason RG, Bartlett NR. Latency and duration of eye movements in the horizontal plane. J Opt Soc Am. 1962;52:210–213. - PubMed

LinkOut - more resources