. 2013 Oct 29:9:701.
doi: 10.1038/msb.2013.59.

Promoters maintain their relative activity levels under different growth conditions

Affiliations

Promoters maintain their relative activity levels under different growth conditions

Leeat Keren et al. Mol Syst Biol. .

Abstract

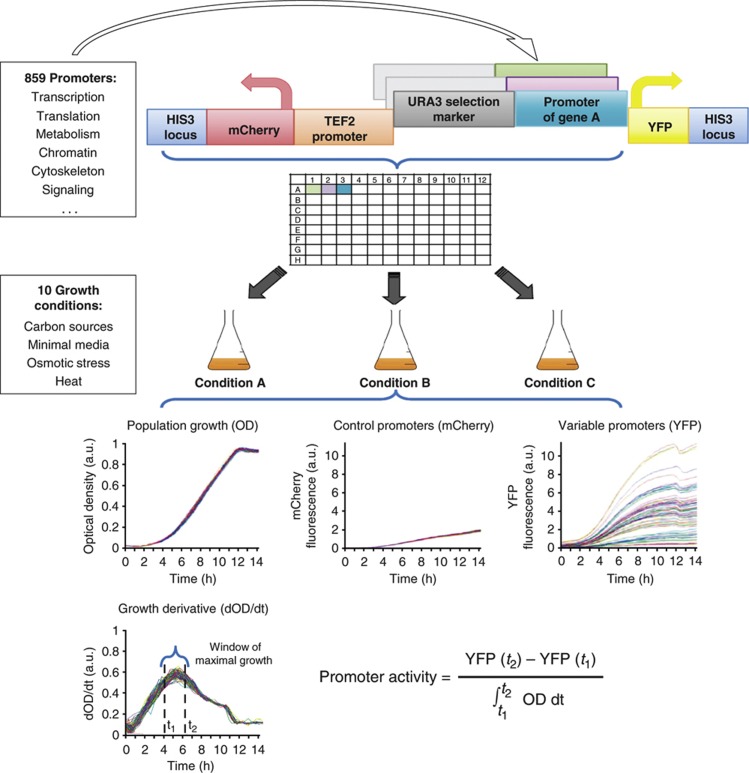
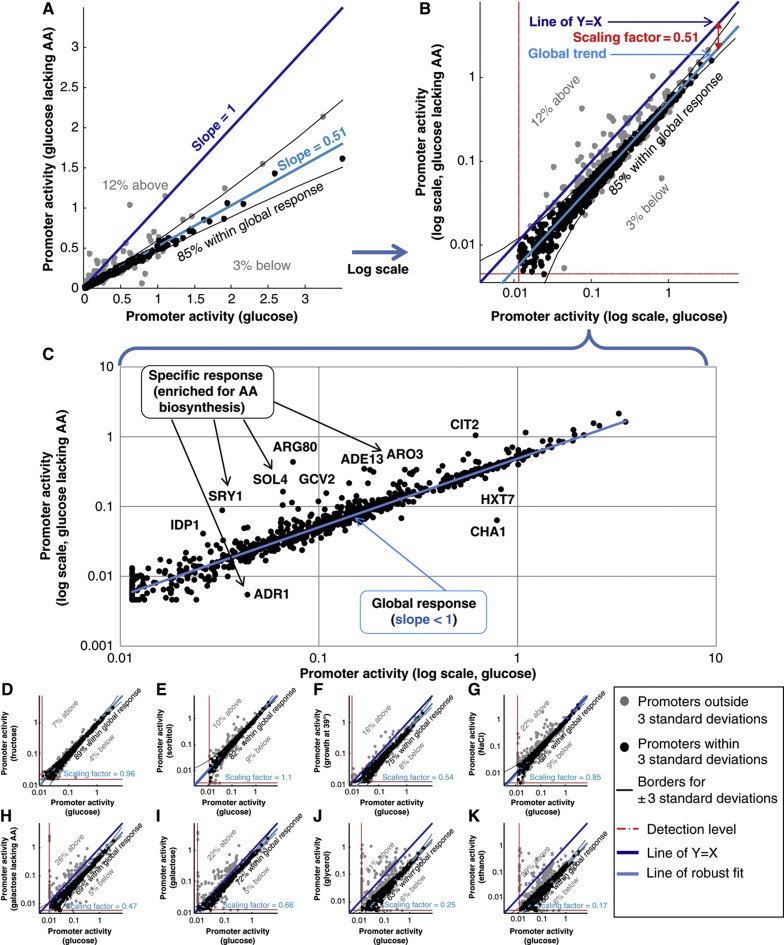
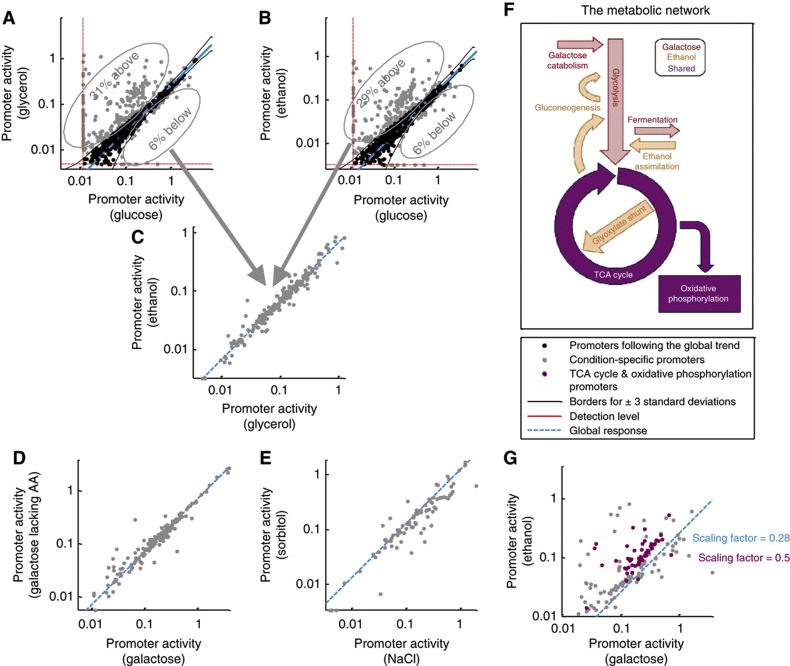
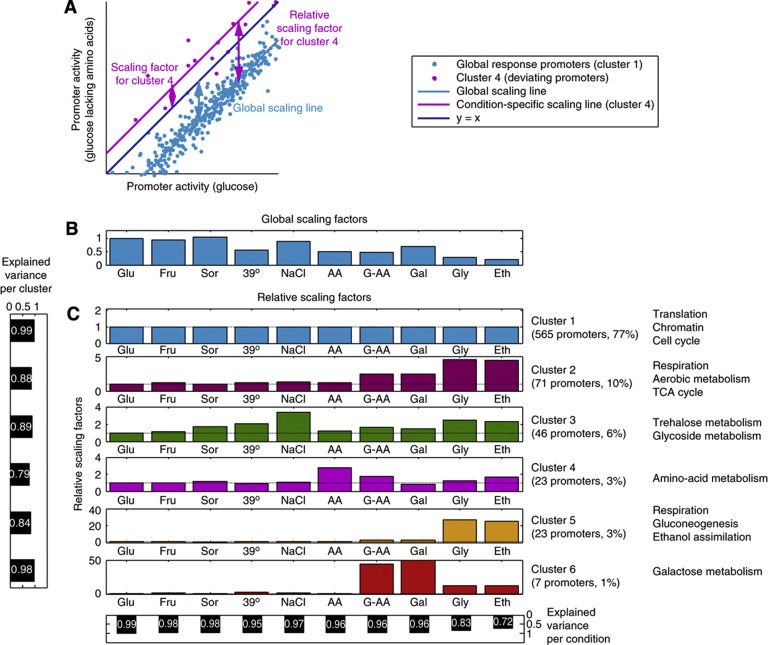
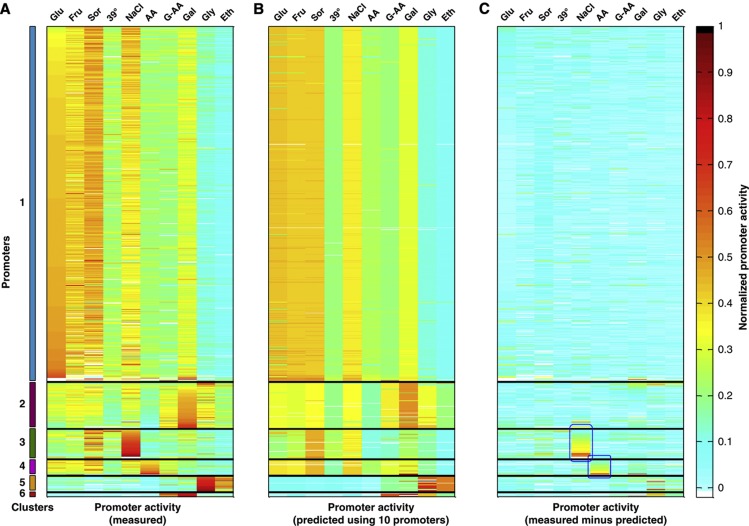
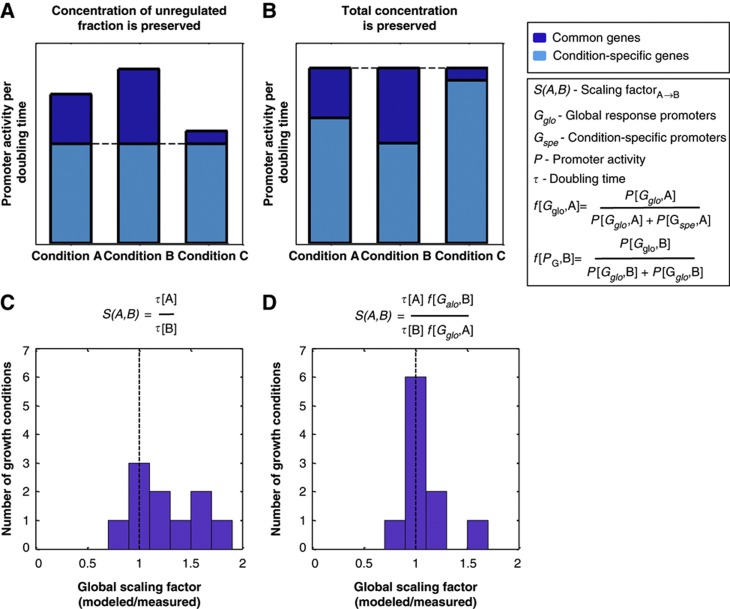
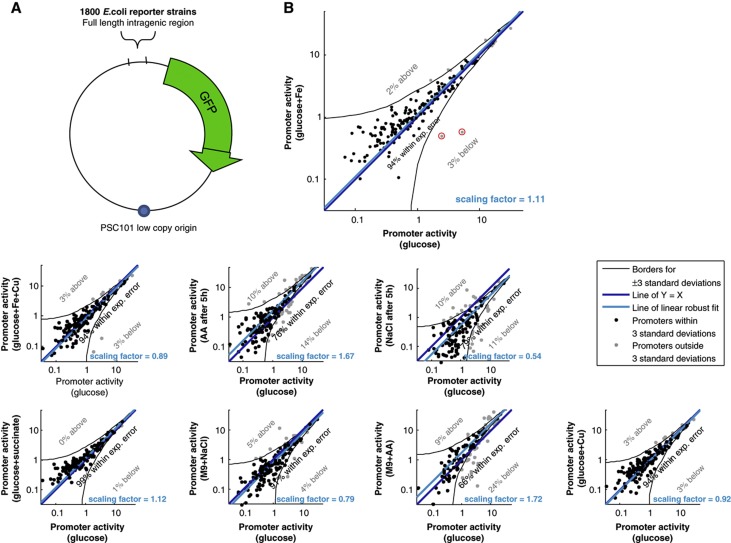
Most genes change expression levels across conditions, but it is unclear which of these changes represents specific regulation and what determines their quantitative degree. Here, we accurately measured activities of ~900 S. cerevisiae and ~1800 E. coli promoters using fluorescent reporters. We show that in both organisms 60-90% of promoters change their expression between conditions by a constant global scaling factor that depends only on the conditions and not on the promoter's identity. Quantifying such global effects allows precise characterization of specific regulation-promoters deviating from the global scale line. These are organized into few functionally related groups that also adhere to scale lines and preserve their relative activities across conditions. Thus, only several scaling factors suffice to accurately describe genome-wide expression profiles across conditions. We present a parameter-free passive resource allocation model that quantitatively accounts for the global scaling factors. It suggests that many changes in expression across conditions result from global effects and not specific regulation, and provides means for quantitative interpretation of expression profiles.


Conflict of interest statement

The authors declare that they have no conflict of interest.

Figures

Figure 1
Figure 1
Strain construction and promoter activity measurements. Illustration of our experimental system. The master strain into which we inserted the 859 different native yeast promoters that comprise our library is shown. Every promoter is integrated into the HIS3 locus upstream of a yellow fluorescent reporter (YFP). The master strain also includes a second mCherry reporter, driven by the same TEF2 promoter across all strains. Measurements are done in 96-well plates, where each well contains a different promoter strain, and cell density (OD), and YFP and mCherry fluorescence are measured along the entire growth curves of each tested growth condition. The low variation in OD and mCherry measurements across strains indicates that all strains grow similarly and that experimental variability is small, compared with the large span of the YFP values. For each strain in every growth condition, promoter activity was calculated as the YFP production rate per OD per second in the window of maximal growth (dashed black lines). Values from 1 to 6 replicate experiments were averaged to extract final promoter activities and standard deviations.
Figure 2
Figure 2
Most promoters preserve their relative activity levels across conditions. (A) The promoter activity in glucose (x axis) and glucose lacking amino acids (y axis) is shown. Black lines represent three standard deviations of experimental noise around a robust linear fit to the data (cyan line) (Materials and methods). The slope of the robust linear fit represents the global scaling factor between the two conditions and is notably different than 1 (blue line), indicating that absolute values change between the conditions, but in a proportional manner. Promoters are colored black or gray depending on whether they fall within or outside the black lines, respectively. Dashed red lines indicate the lowest promoter activity level detected by our experimental system. (B) Same as in (A), but in logarithmic scale. Here, the scaling is reflected by the vertical shift between the blue and cyan lines. (C) Zoom-in on (B), showing the major global response and the identities of several specifically responding genes, all involved in amino-acid metabolism. (D–K) Same as in (B), but when comparing glucose (x axis) to fructose (D), sorbitol 1 M (E), growth at 39°C (F), NaCl 1 M (G), galactose lacking amino acids (H), galactose (I), glycerol (J), and ethanol (K).
Figure 3
Figure 3
Condition-specific promoters are functionally related and preserve proportionality across conditions in which they are activated. (A, B) Same as in Figure 2I and J, comparing promoter activities in glucose (x axis) and glycerol (y axis, A) or ethanol (B). (C) A comparison of shared condition-specific promoters (gray dots) from (A) and (B) between glycerol (x axis) and ethanol (y axis) is shown. Promoters display proportional activities, as indicated by their alignment to a straight line. The scaling factor for this subset of promoters is indistinguishable from the global scaling factor (cyan dashed line) with which the majority of promoters scale between these two conditions. (D) Same as in (C), for condition-specific promoters of galactose (x axis) and galactose lacking amino acids (y axis). (E) Same as in (C), for condition-specific promoters of NaCl 1 M (x axis) and sorbitol 1 M (y axis). (F) A schematic representation of central carbon metabolism in S. cerevisiae. Pathways are colored according to their literature-known activation in galactose (red), ethanol (orange), or both (purple). (G) Same as in (C), for condition-specific promoters of galactose (x axis) and ethanol (y axis). The subset of promoters belonging to the metabolic pathways activated in both conditions (purple in F) is colored in purple. These promoters display proportional activities as indicated by their alignment to a straight line. The scaling factor for this subset of promoters is different from the global scaling factor (cyan dashed line) with which most promoters scale between these two conditions.
Figure 4
Figure 4
Promoter activity profiles of every condition can be accurately described by a handful of scaling factors. (A) Promoter activities are compared between glucose lacking amino acids and glucose, as a zoom-in on Figure 2B. Promoters were clustered by their angle with the origin (Materials and methods). For each condition, both the global scaling factor, pertaining to the majority of promoters, and specific scaling factors were extracted. Since most genes scale with the global scaling, the relative specific scaling factors (relative to the global scaling factor) are of interest in the quantification of specific regulation. (B) Global scaling factors for all conditions, arbitrarily setting glucose to 1. Growth conditions abbreviations: Glu (glucose), Fru (fructose), Sor (sorbitol 1 M), 39°C (growth at 39°C), NaCl (NaCl 1 M), AA (glucose lacking amino acids), G-AA (galactose lacking amino acids), Gal (galactose), Gly (glycerol), Eth (ethanol). (C) Promoter activities across all conditions were clustered into six clusters in a 10-dimentional space (Materials and methods). In each condition, each cluster of genes scales by a unique scaling factor with low variability between the members of the cluster (left panel). Since all scaling factors (s.f.) in all conditions are relative to the global scaling factor of the condition, their values are indicative of relative activation (s.f.>1), repression (s.f.<1) or consistency (s.f.=1) with the global scaling factor. The majority of promoters belong to the first cluster, scaling by the global scaling factor in all conditions. Selected GO terms that were enriched are indicated next to each cluster (for a more comprehensive list of enriched GO terms, see Supplementary Table S6). Using these scaling factors, we can accurately account for the variance in promoter activity in each condition (bottom panel).
Figure 5
Figure 5
Accurate prediction of promoter activities from several representative promoters. (A) Clustering of promoter activities where the value at row i and column j represents the activity level of promoter i in the jth growth condition. Promoter activities were normalized across each row by dividing each entry by the vector norm such that values in each row sum to one. Growth conditions are abbreviated as in Figure 4B. (B) The same matrix from (A), but where promoter activities in each condition correspond to predictions. For each condition, predictions were generated using a clustering of the promoter activities of all other conditions and the values of 10 predefined representative promoters from the tested condition (Materials and methods). Predicted values were normalized as in (A). (C) The difference between the clustered matrices in (A) and (B) is shown. Blue boxes denote outlier clusters that are poorly predicted (e.g., the strong activation of cluster 3 in NaCl, Supplementary material 1.3).
Figure 6
Figure 6
A passive resource allocation model accounts for a large fraction of the global scaling factors across conditions. (A, B) Two proposed models for cellular invariants that result in the observed scaling factors: (A) Concentration of unregulated fraction is preserved. This model posits that growth rate accounts for the global scaling factors. It assumes that promoters that are not differentially regulated between conditions preserve their activity per doubling time. This entails the global scaling factor to be equal to the ratio between the doubling times of the compared conditions. (B) Total concentration is preserved. This model posits that both the growth rate and the magnitude of the specific response account for the global scaling factors. It assumes that the sum of activities over all promoters per doubling time is preserved. Promoters that are not differentially regulated between conditions will proportionally scale to accommodate the specific response in each condition. (C, D) Histogram of the ratio between the observed global scaling factors and those suggested by models (A) and (B) respectively.
Figure 7
Figure 7
Most E. coli promoters preserve their relative activity levels across conditions. (A) Reporter low-copy plasmid has a full-length intragenic region from E coli MG1655 driving the rapidly folding, non-toxic green fluorescent protein variant gfpmut2. Altogether, 1800 strains each corresponding to a different promoter were grown in 96-well plates in 37°C shaker incubator, and robotically moved every 8 min to a multi-well fluorometer for measuring GFP fluorescence and optical density over 24 h of growth. (B) Shown is a comparison of promoter activities glucose (x axis) and all other tested conditions (y axis) for the detectable E. coli promoters, as in Figure 2. Black lines represent three standard deviations around a robust linear fit to the data (cyan line). Promoters are colored black or gray depending on whether they fall within or outside the black lines, respectively. Scaling is reflected by the vertical shift between the blue and cyan lines.

Similar articles

Cited by

References

    1. Ashburner M, Ball CA, Blake JA, Botstein D, Butler H, Cherry JM, Davis AP, Dolinski K, Dwight SS, Eppig JT, Harris MA, Hill DP, Issel-Tarver L, Kasarskis A, Lewis S, Matese JC, Richardson JE, Ringwald M, Rubin GM, Sherlock G (2000) Gene ontology: tool for the unification of biology. The Gene Ontology Consortium. Nat Genet 25: 25–29 - PMC - PubMed
    1. Badis G, Chan ET, van Bakel H, Pena-Castillo L, Tillo D, Tsui K, Carlson CD, Gossett AJ, Hasinoff MJ, Warren CL, Gebbia M, Talukder S, Yang A, Mnaimneh S, Terterov D, Coburn D, Li Yeo A, Yeo ZX, Clarke ND, Lieb JD et al. (2008) A library of yeast transcription factor motifs reveals a widespread function for Rsc3 in targeting nucleosome exclusion at promoters. Mol Cell 32: 878–887 - PMC - PubMed
    1. Bakel H Van, Holstege FCP (2008) A tutorial for DNA microarray expression profiling. Cell Evaluating: 22–28 , Available at: http://download.cell.com/images/edimages/etbr/VANBAKEL.PDF
    1. Balázsi G, Oltvai ZN (2007) A pitfall in series of microarrays: the position of probes affects the cross-correlation of gene expression profiles. Methods Mol Biol (Clifton, NJ) 377: 153–162 - PubMed
    1. Bammler T, Beyer RP, Bhattacharya S, Boorman GA, Boyles A, Bradford BU, Bumgarner RE, Bushel PR, Chaturvedi K, Choi D, Cunningham ML, Deng S, Dressman HK, Fannin RD, Farin FM, Freedman JH, Fry RC, Harper A, Humble MC, Hurban P et al. (2005) Standardizing global gene expression analysis between laboratories and across platforms. Nat Meth 2: 351–356 - PubMed

Publication types

MeSH terms