

Functional proteomic discovery of Slr0110 as a central regulator of carbohydrate metabolism in Synechocystis species PCC6803
- PMID: 24169622
- PMCID: PMC3879615
- DOI: 10.1074/mcp.M113.033803
Functional proteomic discovery of Slr0110 as a central regulator of carbohydrate metabolism in Synechocystis species PCC6803
Abstract
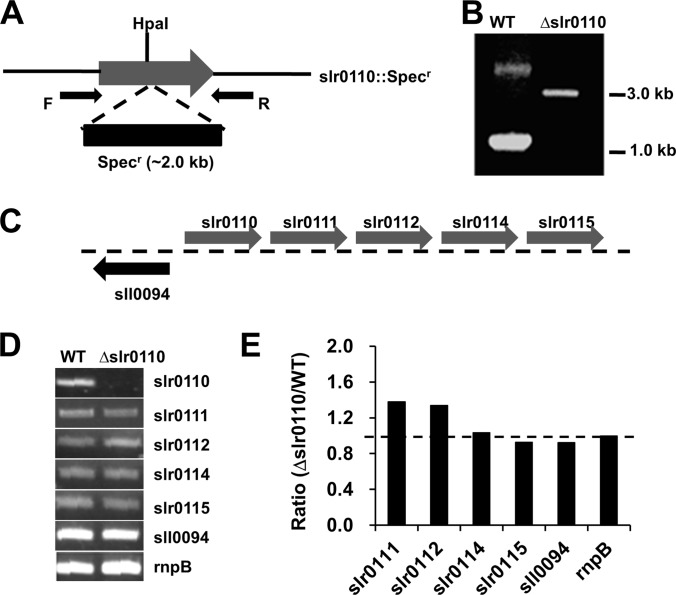
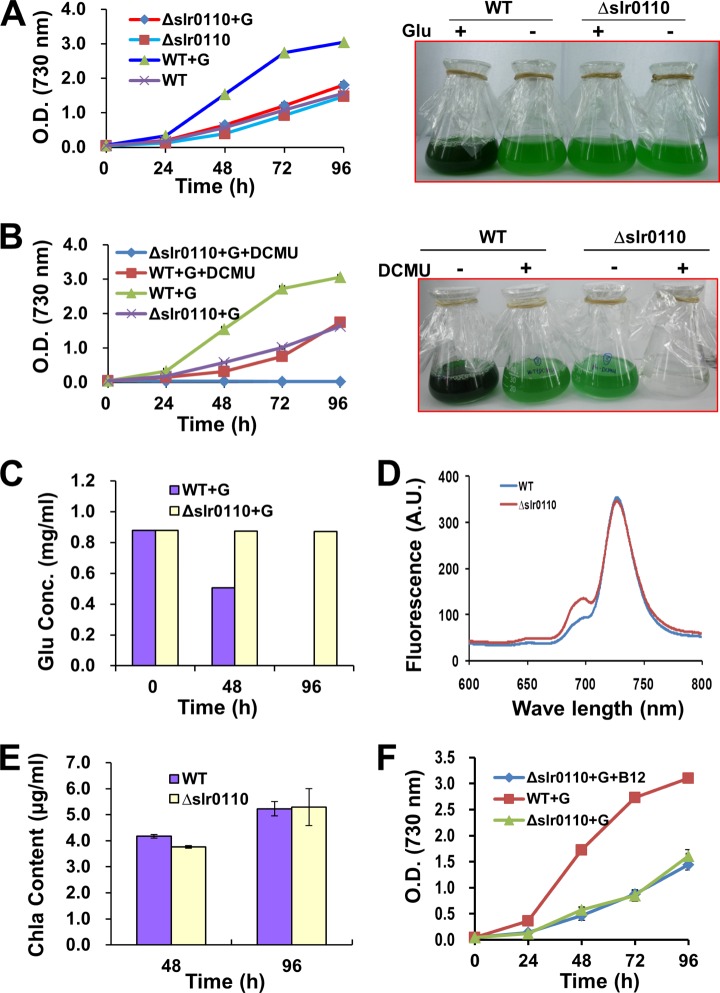
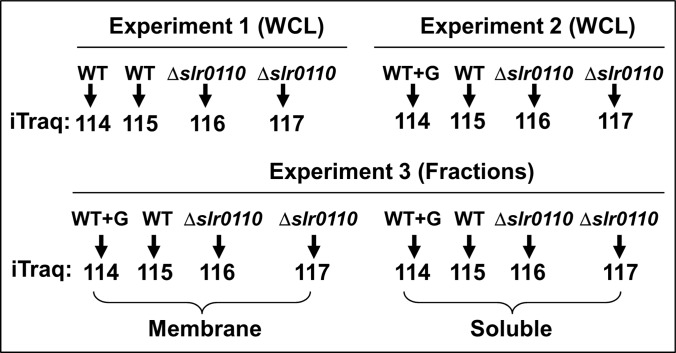
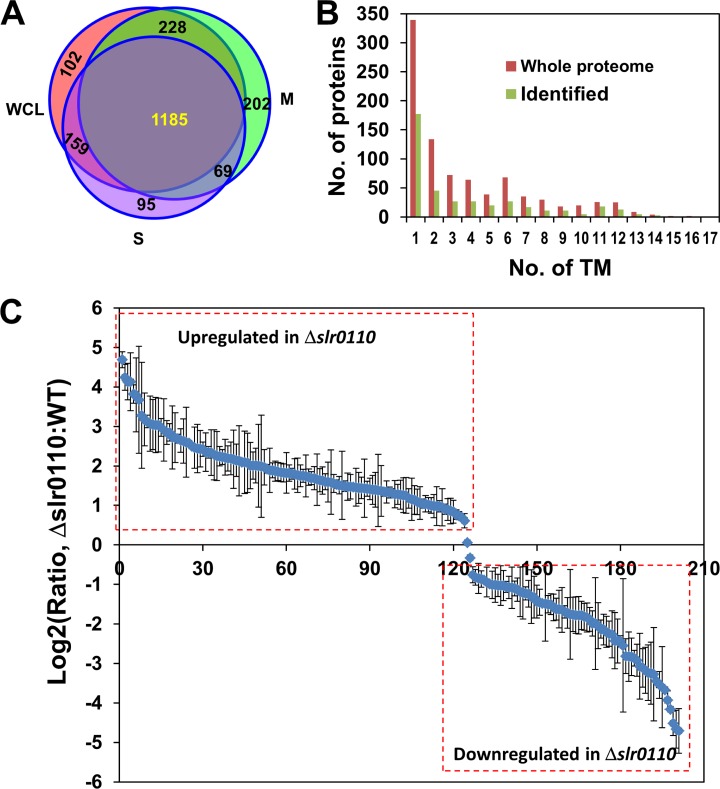
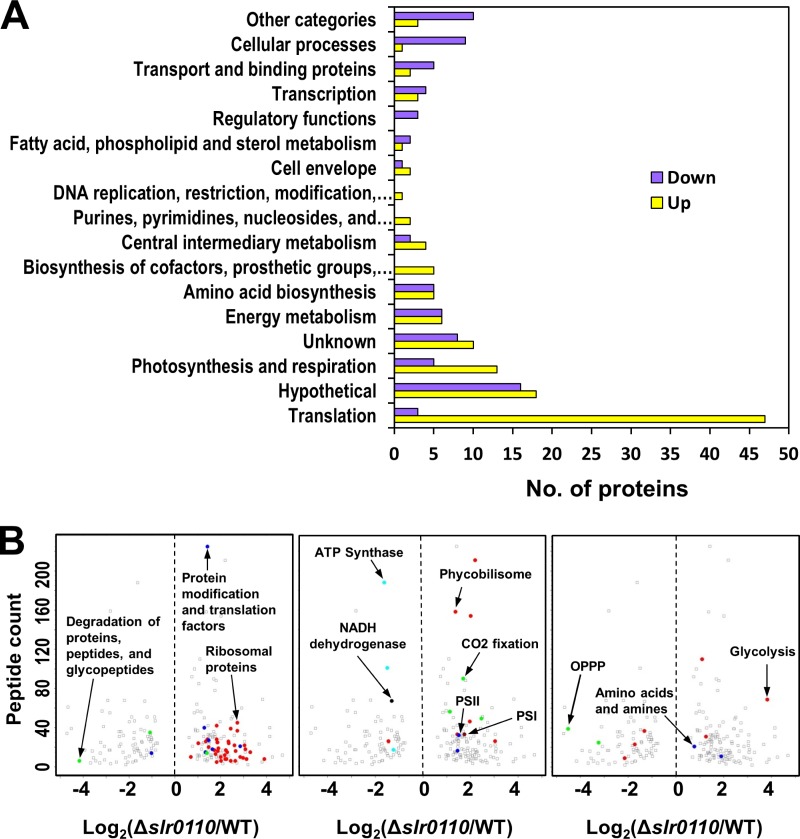
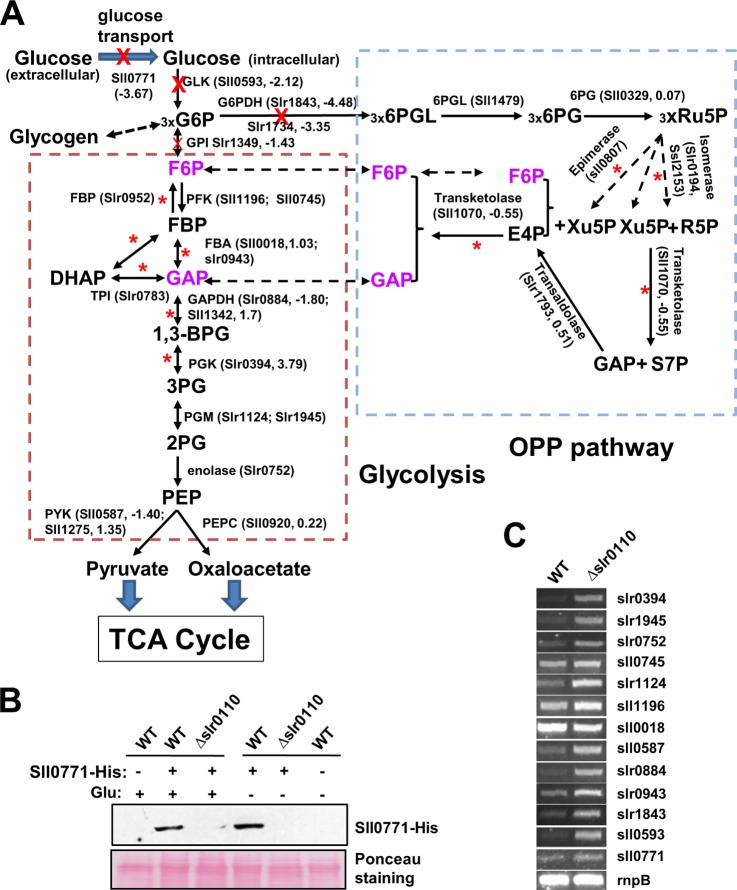
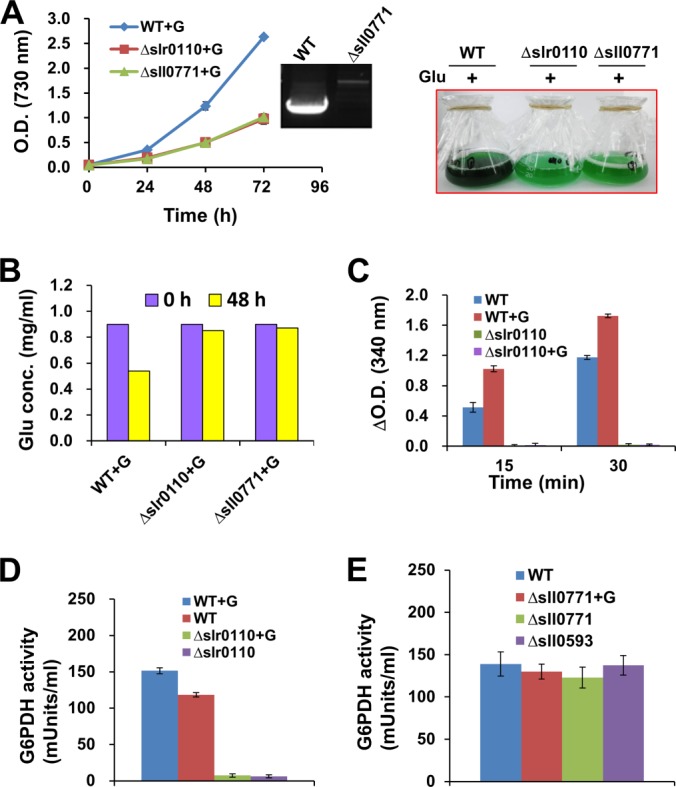
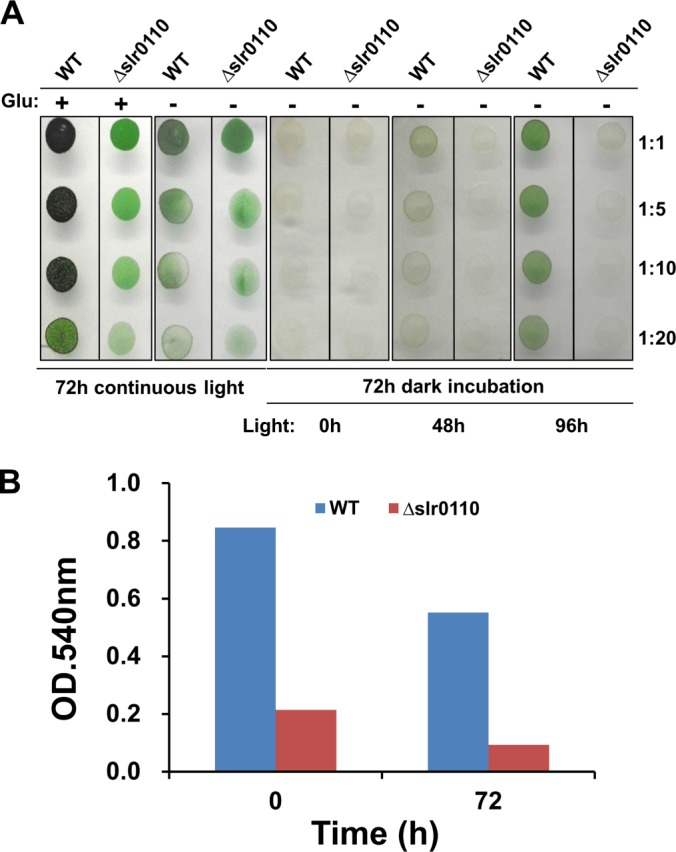
The unicellular photosynthetic model-organism cyanobacterium Synechocystis sp. PCC6803 can grow photoautotrophically using CO2 or heterotrophically using glucose as the sole carbon source. Several pathways are involved in carbon metabolism in Synechocystis, and the concerted regulation of these pathways by numerous known and unknown genes is critical for the survival and growth of the organism. Here, we report that a hypothetical protein encoded by the open reading frame slr0110 is necessary for heterotrophic growth of Synechocystis. The slr0110-deletion mutant is defective in glucose uptake, heterotrophic growth, and dark viability without detectable defects in autotrophic growth, whereas the level of photosystem II and the rate of oxygen evolution are increased in the mutant. Quantitative proteomic analysis revealed that several proteins in glycolysis and the oxidative pentose phosphate pathway are down-regulated, whereas proteins in photosystem II and phycobilisome are significantly up-regulated, in the mutant. Among the down-regulated proteins are glucose transporter, glucokinase, glucose-6-phosphate isomerase, and glucose-6-phosphate dehydrogenase and its assembly protein OpcA, suggesting that glycolysis, oxidative pentose phosphate, and glycogen synthesis pathways are significantly inhibited in the mutant, which was further confirmed by enzymatic assays and quantification of glycogen content. These findings establish Slr0110 as a novel central regulator of carbon metabolism in Synechocystis, and shed light on an intricate mechanism whereby photosynthesis and carbon metabolism are well concerted to survive the crisis when one or more pathways of the system are impaired.
Figures
Similar articles
-
Glycogen synthesis prevents metabolic imbalance and disruption of photosynthetic electron transport from photosystem II during transition to photomixotrophy in Synechocystis sp. PCC 6803.New Phytol. 2024 Jul;243(1):162-179. doi: 10.1111/nph.19793. Epub 2024 May 6. New Phytol. 2024. PMID: 38706429
-
Pleiotropic effect of a histidine kinase on carbohydrate metabolism in Synechocystis sp. strain PCC 6803 and its requirement for heterotrophic growth.J Bacteriol. 2005 Apr;187(7):2368-76. doi: 10.1128/JB.187.7.2368-2376.2005. J Bacteriol. 2005. PMID: 15774880 Free PMC article.
-
Positive regulation of sugar catabolic pathways in the cyanobacterium Synechocystis sp. PCC 6803 by the group 2 sigma factor sigE.J Biol Chem. 2005 Sep 2;280(35):30653-9. doi: 10.1074/jbc.M505043200. Epub 2005 Jun 8. J Biol Chem. 2005. PMID: 15944148
-
A novel periplasmic protein (Slr0280) tunes photomixotrophic growth of the cyanobacterium, Synechocystis sp. PCC 6803.Gene. 2016 Jan 10;575(2 Pt 1):313-20. doi: 10.1016/j.gene.2015.09.015. Epub 2015 Sep 11. Gene. 2016. PMID: 26367329
-
The involvement of allosteric effectors and post-translational modifications in the control of plant central carbon metabolism.Plant J. 2023 Jun;114(5):1037-1058. doi: 10.1111/tpj.16215. Epub 2023 May 16. Plant J. 2023. PMID: 37092344 Review.
Cited by
-
Genetic, Genomics, and Responses to Stresses in Cyanobacteria: Biotechnological Implications.Genes (Basel). 2021 Mar 29;12(4):500. doi: 10.3390/genes12040500. Genes (Basel). 2021. PMID: 33805386 Free PMC article. Review.
-
Proximity Labeling Facilitates Defining the Proteome Neighborhood of Photosystem II Oxygen Evolution Complex in a Model Cyanobacterium.Mol Cell Proteomics. 2022 Dec;21(12):100440. doi: 10.1016/j.mcpro.2022.100440. Epub 2022 Nov 8. Mol Cell Proteomics. 2022. PMID: 36356940 Free PMC article.
-
Substrate-independent immunomodulatory characteristics of mesenchymal stem cells in three-dimensional culture.PLoS One. 2018 Nov 8;13(11):e0206811. doi: 10.1371/journal.pone.0206811. eCollection 2018. PLoS One. 2018. PMID: 30408051 Free PMC article.
-
Toward the complete proteome of Synechocystis sp. PCC 6803.Photosynth Res. 2015 Dec;126(2-3):203-19. doi: 10.1007/s11120-015-0140-y. Epub 2015 Apr 11. Photosynth Res. 2015. PMID: 25862646 Review.
-
The regulatory impact of serine/threonine-specific protein phosphorylation among cyanobacteria.Front Plant Sci. 2025 Feb 12;16:1540914. doi: 10.3389/fpls.2025.1540914. eCollection 2025. Front Plant Sci. 2025. PMID: 40012730 Free PMC article. Review.
References
-
- De Marais D. J. (2000) Evolution. When did photosynthesis emerge on Earth? Science 289, 1703–1705 - PubMed
-
- Johnson Z. I., Zinser E. R., Coe A., McNulty N. P., Woodward E. M., Chisholm S. W. (2006) Niche partitioning among Prochlorococcus ecotypes along ocean-scale environmental gradients. Science 311, 1737–1740 - PubMed
-
- Kasting J. F., Siefert J. L. (2002) Life and the evolution of Earth's atmosphere. Science 296, 1066–1068 - PubMed
-
- Goksoyr J. (1967) Evolution of eucaryotic cells. Nature 214, 1161. - PubMed
Publication types
MeSH terms
Substances
LinkOut - more resources
Full Text Sources
Other Literature Sources
