

Evolution of intracerebral hemorrhage after intravenous tPA: reversal of harmful effects with mast cell stabilization
- PMID: 24169849
- PMCID: PMC3887361
- DOI: 10.1038/jcbfm.2013.189
Evolution of intracerebral hemorrhage after intravenous tPA: reversal of harmful effects with mast cell stabilization
Abstract
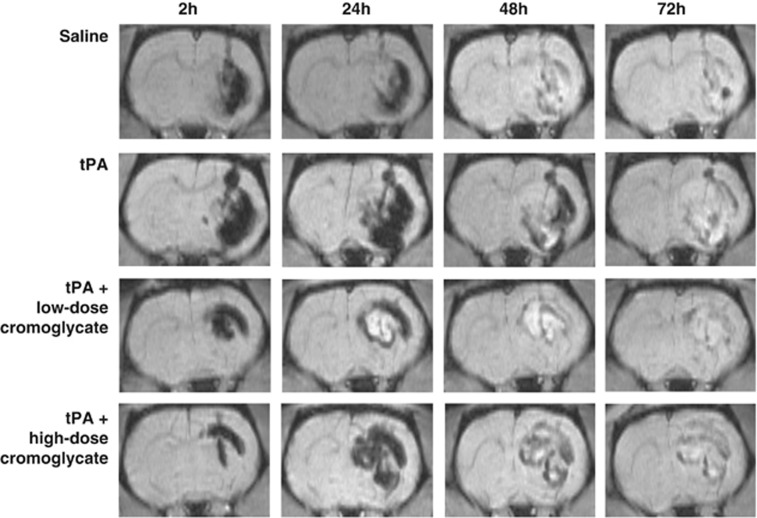
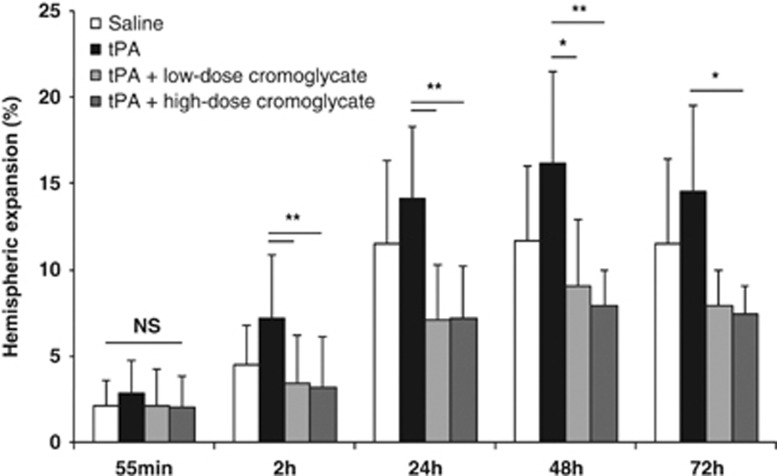
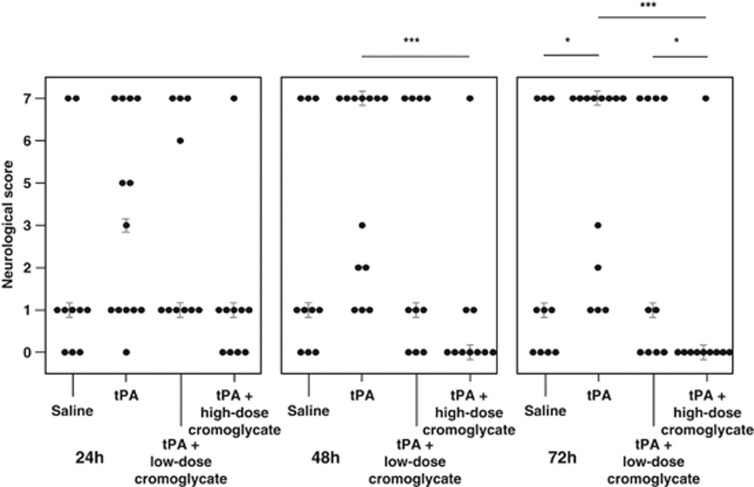
Thrombolysis with tissue plasminogen activator (tPA) traditionally demands baseline imaging to rule out intracerebral hemorrhage (ICH), which causes delays in treatment. Preventing possible adverse effects of tPA on ICH would allow rapid on-site thrombolysis in patients with presumed acute ischemic stroke, reducing onset-to-treatment times. We examined how intravenous tPA alters ICH evolution during an extended follow-up, and how mast cell stabilization affects this process. Intracerebral hemorrhage was induced in rats by collagenase injection. Rats received either saline (n=10), tPA (n=13), tPA+low-dose cromoglycate (n=10), or tPA+high-dose cromoglycate (n=10). Magnetic resonance imaging was performed at 24, 48, and 72 hours after ICH induction, together with neurologic evaluations. During 72 hours of follow-up, tPA administration did not significantly increase hematoma volume (mean±s.d. 83.5±14.3 versus 66.7±14.7 μL; P=0.256) or hemispheric expansion (14.5±5.0 versus 11.5±5.0%; P=0.457) compared with saline. However, tPA-treated animals had worse neurologic outcomes (P<0.05), and mortality (8/13 versus 3/10). Combining tPA with high-dose cromoglycate mitigated hemispheric expansion (7.4±1.7 versus 14.5±5.0%; P=0.01), improved neurologic outcome (P<0.001) and decreased mortality (1/10; P<0.05) compared with tPA alone. Our results suggest tPA increases neurologic deficit in ICH, an effect that was abolished by concomitant mast cell stabilization. Further studies are needed to establish the clinical relevance of these findings.
Figures


Similar articles
-
Mast cell stabilization reduces hemorrhage formation and mortality after administration of thrombolytics in experimental ischemic stroke.Circulation. 2007 Jul 24;116(4):411-8. doi: 10.1161/CIRCULATIONAHA.106.655423. Epub 2007 Jul 2. Circulation. 2007. PMID: 17606844
-
Hematoma expansion in experimental intracerebral hemorrhage is not altered by peracute treatment with recombinant tissue plasminogen activator.Neuroscience. 2013 Oct 10;250:181-8. doi: 10.1016/j.neuroscience.2013.07.003. Epub 2013 Jul 13. Neuroscience. 2013. PMID: 23856067
-
Urokinase, a promising candidate for fibrinolytic therapy for intracerebral hemorrhage.J Neurosurg. 2017 Feb;126(2):548-557. doi: 10.3171/2016.1.JNS152287. Epub 2016 Apr 22. J Neurosurg. 2017. PMID: 27104852
-
Current status of intravenous thrombolysis for acute ischemic stroke in Asia.Int J Stroke. 2011 Dec;6(6):523-30. doi: 10.1111/j.1747-4949.2011.00671.x. Int J Stroke. 2011. PMID: 22111797 Review.
-
Role of tissue plasminogen activator in acute ischemic stroke.Ann Pharmacother. 2011 Mar;45(3):364-71. doi: 10.1345/aph.1P525. Epub 2011 Mar 8. Ann Pharmacother. 2011. PMID: 21386027 Review.
Cited by
-
Hematoma Expansion Following Intracerebral Hemorrhage: Mechanisms Targeting the Coagulation Cascade and Platelet Activation.Curr Drug Targets. 2017;18(12):1329-1344. doi: 10.2174/1389450118666170329152305. Curr Drug Targets. 2017. PMID: 28378693 Free PMC article. Review.
-
Potential therapeutic targets for intracerebral hemorrhage-associated inflammation: An update.J Cereb Blood Flow Metab. 2020 Sep;40(9):1752-1768. doi: 10.1177/0271678X20923551. Epub 2020 May 19. J Cereb Blood Flow Metab. 2020. PMID: 32423330 Free PMC article. Review.
-
Targeting vascular inflammation in ischemic stroke: Recent developments on novel immunomodulatory approaches.Eur J Pharmacol. 2018 Aug 15;833:531-544. doi: 10.1016/j.ejphar.2018.06.028. Epub 2018 Jun 20. Eur J Pharmacol. 2018. PMID: 29935175 Free PMC article. Review.
-
Preliminary Analysis of Aging-Related Genes in Intracerebral Hemorrhage by Integration of Bulk and Single-Cell RNA Sequencing Technology.Int J Gen Med. 2024 Jun 12;17:2719-2740. doi: 10.2147/IJGM.S457480. eCollection 2024. Int J Gen Med. 2024. PMID: 38883702 Free PMC article.
-
The Role of Mast Cells in Stroke.Cells. 2019 May 10;8(5):437. doi: 10.3390/cells8050437. Cells. 2019. PMID: 31083342 Free PMC article. Review.
References
-
- Lees KR, Bluhmki E, Kummer von R, Brott TG, Toni D, Grotta JC, et al. Time to treatment with intravenous alteplase and outcome in stroke: an updated pooled analysis of ECASS, ATLANTIS, NINDS, and EPITHET trials. Lancet. 2010;375:1695–1703. - PubMed
-
- Runchey S, McGee S. Does this patient have a hemorrhagic stroke?: clinical findings distinguishing hemorrhagic stroke from ischemic stroke. JAMA. 2010;303:2280–2286. - PubMed
-
- Foerch C, Niessner M, Back T, Bauerle M, De Marchis GM, Ferbert A, et al. Diagnostic accuracy of plasma glial fibrillary acidic protein for differentiating intracerebral hemorrhage and cerebral ischemia in patients with symptoms of acute stroke. Clin Chem. 2012;58:237–245. - PubMed
Publication types
MeSH terms
Substances
LinkOut - more resources
Full Text Sources
Other Literature Sources
